I Do Not Judge Performance Marketing From One Metric
One of the biggest mistakes I see in paid acquisition is trying to reduce performance to one number.
Sometimes that number is ROAS.
Sometimes it is CPL.
Sometimes it is CAC.
But I have learned that no single metric tells me enough on its own.
The way I think about performance marketing metrics is much more practical:
Which number is telling me what is happening, and what decision should I make because of it?
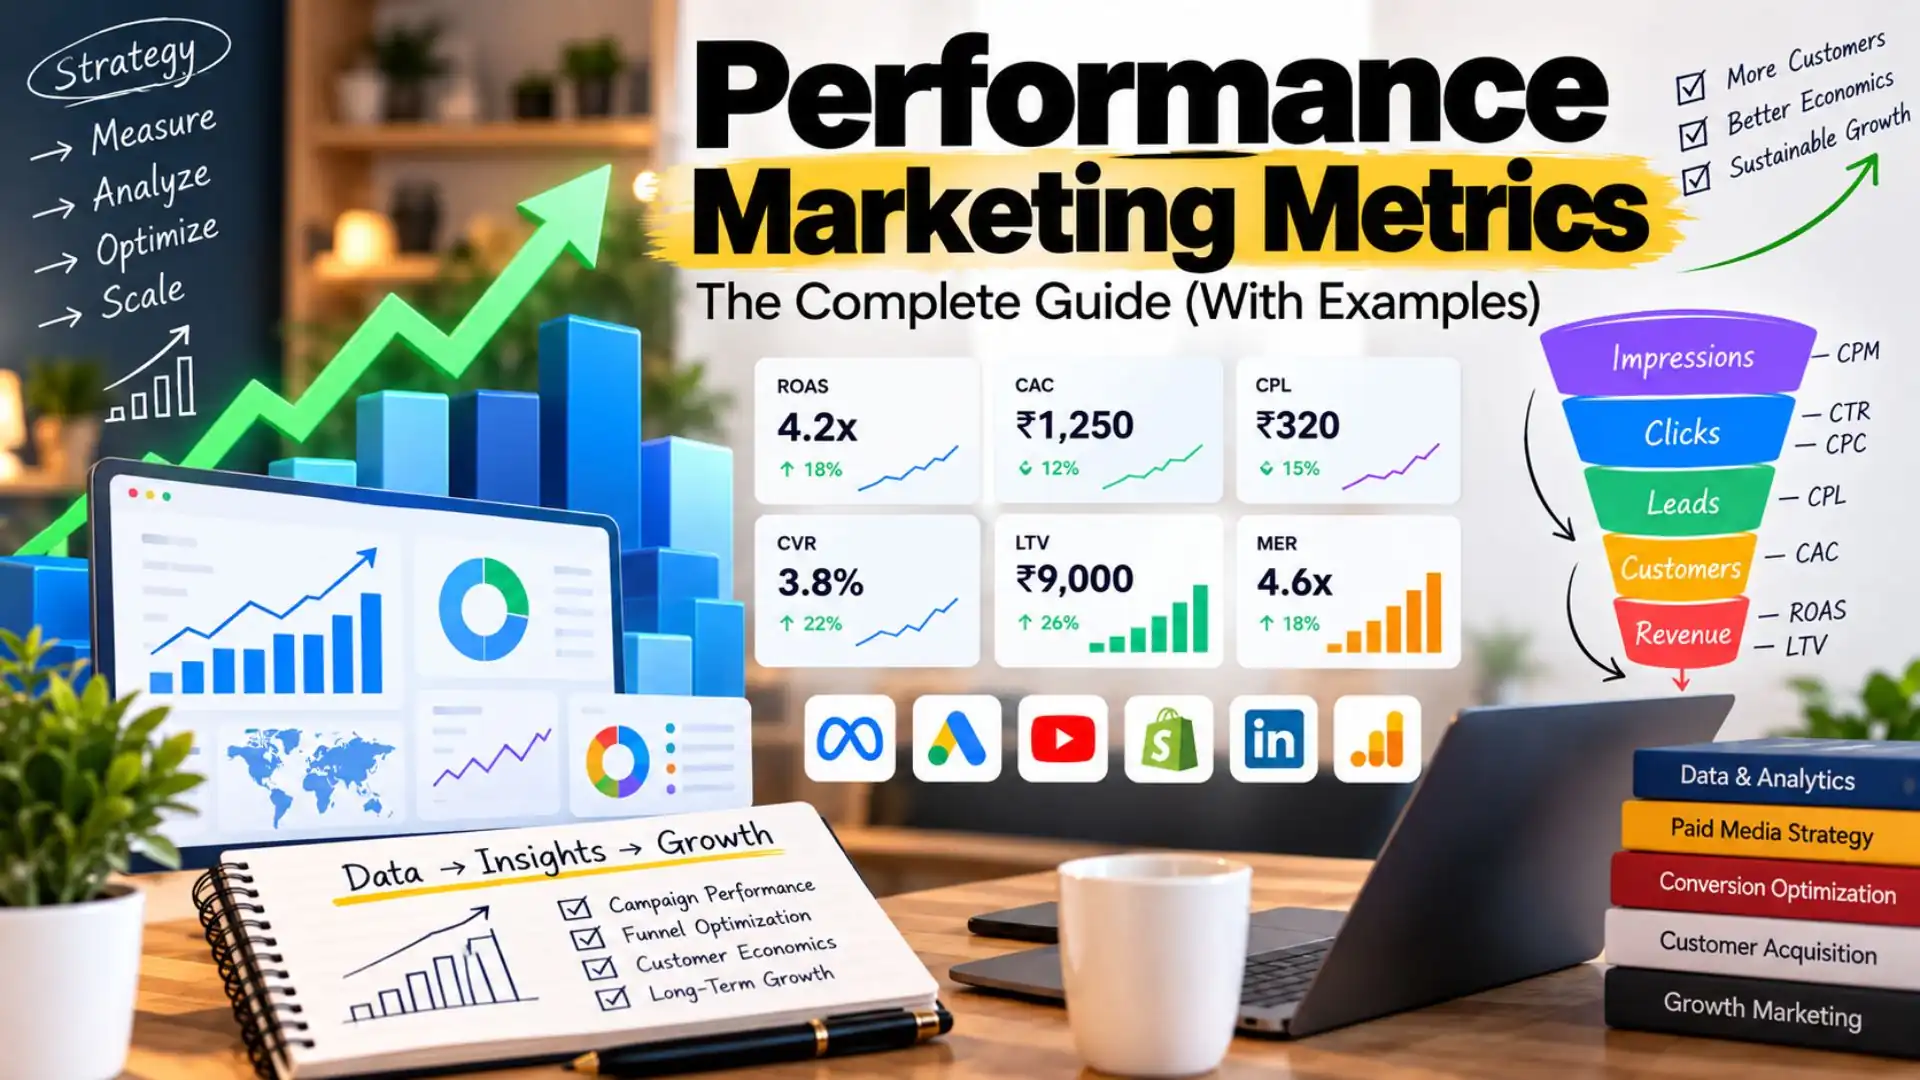
ROAS Can Look Great While the Business Is Not Actually Growing
If someone tells me a campaign is generating 5X ROAS, I still want more context.
How much is being spent?
How much of that revenue is coming from new customers?
How much is branded demand?
How much is remarketing?
What margin is left after discounts, fulfilment and other costs?
A high ROAS can be useful, but I do not treat it as the final answer.
CPL Can Look Cheap While Sales Stay Weak
This happens all the time in lead generation.
A campaign can generate very cheap leads and still produce poor business outcomes.
If the sales team cannot close those leads, the low CPL is not helping much.
That is why I try to move the measurement further down the funnel whenever the data allows me to.
I want to understand:
Lead → Qualified Lead → Opportunity → Customer
For me, that is much more useful than celebrating the cheapest possible lead.
CAC Usually Gets Me Closer to the Real Question
Customer acquisition cost is one of the metrics I care about most because it gets much closer to the actual business outcome.
If I know what it costs to acquire a customer and what that customer is worth, I can make much better scaling decisions.
I can decide whether to increase spend.
I can decide whether the current channel is still healthy.
I can decide whether a higher CPL is acceptable because those leads close better.
That is why I often prefer thinking in terms of CAC rather than platform CPA alone.
Conversion Rate Tells Me Whether the Funnel Is Using the Traffic Well
CVR is one of the fastest ways for me to understand whether the post-click experience is helping or hurting performance.
If CPC stays stable but conversion rate falls, I immediately start looking further down the funnel.
The landing page may have changed.
The traffic quality may have changed.
The offer may be weaker.
The form may be creating more friction.
A conversion-rate problem can make the ad account look broken even when the media buying itself is still healthy.
LTV Changes How Much I May Be Willing to Pay Upfront
This is where first-order metrics can become misleading.
If a business has strong repeat purchase behaviour, subscription revenue or meaningful customer lifetime value, I may be willing to accept a higher first-order CAC.
The customer does not need to become fully profitable on day one if the economics over time still make sense.
But I do not use LTV as an excuse to ignore weak acquisition.
I want the retention assumptions to be based on real customer behaviour, not optimistic projections.
CTR, CPC and CPM Are Diagnostic Metrics for Me
I still watch CTR, CPC and CPM closely.
They are useful because they help me understand why CPL, CPA or CAC changed.
If CPM rises sharply, that tells me one thing.
If CPM is stable but CTR falls, that tells me something else.
If CTR is strong but conversion rate collapses, I move further down the funnel.
These metrics help me diagnose the problem.
I do not treat them as the final business outcome.
The Same Metric Can Mean Different Things at Different Spend Levels
This is another reason I care about context.
A ₹100 CPL at ₹20,000 in total spend tells me something very different from maintaining a similar CPL after spending ₹5 lakh or ₹50 lakh.
Scale changes the way I interpret efficiency.
For example, one education YouTube campaign I worked on generated more than 66,300 leads at approximately ₹76 CPL from around ₹50.4 lakh in spend.
The CPL matters, but the spend and conversion volume give that number much more meaning.
I have discussed this broader measurement mindset in my performance marketing audit framework, where I look at the entire acquisition system instead of one dashboard metric.
I Use Metrics in Layers
The way I normally think about measurement is:
Business outcome → Acquisition metric → Funnel metric → Platform diagnostic metric
For example:
Business outcome: Customers and revenue
Acquisition metric: CAC or ROAS
Funnel metric: CPL or conversion rate
Platform diagnostic metric: CTR, CPC, CPM, frequency or view rate
That order matters to me.
I do not want to optimize a diagnostic metric in a way that makes the business outcome worse.
The Metric I Care About Most Depends on the Business Model
For ecommerce, I may care most about new-customer CAC, contribution margin, AOV and LTV.
For lead generation, I may care more about CPL, qualified lead rate, lead-to-sale conversion and customer acquisition cost.
For a subscription business, payback period and lifetime value become much more important.
For a high-ticket service, the quality of each opportunity may matter far more than raw lead volume.
My Rule Is Simple
A metric is only useful to me if it helps answer one of three questions:
What is happening?
Why is it happening?
What should I do next?
That is how I use performance marketing metrics.
Not as isolated dashboard numbers, but as a way to make better acquisition decisions.
ROAS: Useful, but I Never Look at It Without Context
ROAS is probably the most popular performance marketing metric, especially in ecommerce.
It is also one of the easiest metrics to misread.
I use ROAS regularly, but I almost never make a scaling decision from ROAS alone.
The first thing I ask is:
What kind of revenue is this ROAS actually representing?
I Start With the Basic Formula
The formula is simple:
ROAS = Revenue ÷ Ad Spend
If I spend ₹1 lakh and the campaign reports ₹4 lakh in revenue, the platform ROAS is 4X.
That is useful.
But it is only the beginning of the analysis.
I Want to Know How Much Spend Produced That ROAS
A 6X ROAS at ₹20,000 in spend does not tell me the same thing as a 4X ROAS at ₹20 lakh in spend.
The first may be more efficient.
The second may be creating much more useful business volume.
That is why I always read ROAS together with spend and revenue volume.
If someone shows me a strong ROAS screenshot without the spend level, I feel like a very important part of the story is missing.
I Separate New Customers From Returning Customers
This matters a lot in ecommerce.
Returning customers usually convert more easily because they already know and trust the brand.
If a large share of revenue comes from existing customers, blended ROAS can look excellent even while new-customer acquisition is becoming expensive.
If the business is trying to grow, I want to understand:
- New-customer revenue
- Returning-customer revenue
- New-customer CAC
- Blended CAC
- Total ROAS or MER
Those numbers tell me much more than one platform ROAS figure.
I Look at Brand and Remarketing Separately
Brand Search and remarketing often produce very strong ROAS.
That is not surprising.
Those users already have some level of intent or familiarity.
The problem comes when those campaigns are blended with cold acquisition and used to make the entire account look more efficient.
I want to know how much of the reported revenue came from demand the business had already created somewhere else.
This is one of the things I specifically look for during a performance marketing audit.
Platform ROAS Is Not the Same as Incremental ROAS
This distinction becomes very important once multiple channels are active.
Meta may claim a purchase.
Google Ads may also claim the same customer.
GA4 may attribute the final conversion differently again.
If I simply add platform-reported revenue together, I can create a completely unrealistic picture.
So while I use platform ROAS for optimization, I also compare it with total business revenue and blended performance.
I Care About Margin Behind the Revenue
Two businesses can both generate 4X ROAS and have completely different profitability.
One may have 70% gross margin.
Another may have 25% margin after product cost, discounting and fulfilment.
The same ROAS does not create the same business outcome.
That is why I like connecting ROAS with contribution margin whenever the business has that data available.
Break-Even ROAS Matters More Than Arbitrary Benchmarks
I do not like generic statements such as:
“3X ROAS is good.”
Good compared with what?
The real question is what ROAS the business needs to cover its economics.
If a business breaks even at 1.6X, a 2.5X ROAS may be very healthy.
If another business needs 3.2X just to cover acquisition and fulfilment costs, the same 2.5X is a problem.
I want the performance target connected to the unit economics, not an industry slogan.
I Do Not Protect High ROAS at the Expense of Growth
This is another thing I have changed my mind about over the years.
Earlier, it is easy to become obsessed with protecting the highest possible ROAS.
But sometimes the business should accept a lower ROAS if the additional spend is still profitable.
Suppose one campaign is producing 6X ROAS at ₹1 lakh in spend.
If increasing spend to ₹5 lakh reduces ROAS to 4X but still creates healthy contribution and much more revenue, I may consider that a better business outcome.
The goal is not to maximize the ratio at all costs.
The goal is to create profitable growth.
I Watch How ROAS Changes as Spend Increases
This is where marginal performance becomes important.
If ROAS stays relatively stable while spend increases, I gain confidence that the channel has more room.
If ROAS falls sharply every time I increase budget, I start investigating.
Is the platform reaching weaker users?
Is creative fatigue appearing?
Is conversion rate falling?
Has the account already captured most of the available high-intent demand?
The change in ROAS often tells me where to look next, but it does not tell me the cause by itself.
I Also Compare ROAS With CAC
ROAS tells me how much revenue is being generated relative to spend.
CAC tells me what it costs to acquire a customer.
I usually want both.
If ROAS looks healthy but new-customer CAC keeps rising, I want to understand whether returning-customer revenue is masking acquisition weakness.
If CAC is stable but ROAS falls, AOV or product mix may have changed.
The relationship between the metrics often tells me more than either one independently.
My Rule for ROAS Is Simple
I use ROAS to understand revenue efficiency.
I do not use it as a complete definition of performance.
Before I decide whether a ROAS number is actually good, I want to know:
- How much was spent
- How much revenue was generated
- How many customers were acquired
- How much revenue came from new customers
- How much came from remarketing or branded demand
- What margin sits behind that revenue
- How ROAS changes as spend increases
Only then does ROAS become a useful performance marketing KPI rather than just an attractive number in the dashboard.
CAC: The Metric I Usually Trust More Than Platform CPA
If I had to choose one metric that gets me closer to the real business outcome, it would usually be customer acquisition cost.
That is because CAC forces me to ask a more useful question than:
“How much did the platform say a conversion cost?”
I want to know:
“How much did the business actually spend to acquire a real customer?”
I Start With the Basic CAC Formula
The simple version is:
CAC = Total Acquisition Spend ÷ Number of New Customers Acquired
If the business spends ₹5 lakh on acquisition and acquires 400 new customers, CAC is ₹1,250.
That gives me a much more useful reference point than looking only at campaign-level CPA.
I Do Not Confuse Platform CPA With Business-Level CAC
Meta may report a purchase at ₹900.
Google Ads may report a conversion at ₹1,050.
But those platform numbers do not always equal the actual cost to acquire a customer.
There can be attribution overlap.
There can be cancellations.
There can be invalid leads.
There can be repeat customers counted alongside new customers.
So I use platform CPA for campaign optimization, but I prefer business-level CAC when I am making larger budget decisions.
I Care Most About New-Customer CAC
This is especially important in ecommerce.
If returning customers are buying again, total platform ROAS can look strong while the cost of acquiring a genuinely new customer keeps rising.
If the business wants growth, I want to know:
- How many new customers were acquired
- How much was spent to acquire them
- What new-customer CAC looks like
- How that CAC changes as spend increases
That tells me much more about whether the acquisition engine is actually expanding the customer base.
For Lead Generation, CAC Sits Further Down the Funnel
This is where CPL and CAC become very different.
Suppose I generate 1,000 leads at ₹200 CPL.
Total lead-generation spend is ₹2 lakh.
If only 40 of those leads become customers, the customer acquisition cost is ₹5,000.
Now suppose another campaign generates leads at ₹350 CPL but converts a much higher percentage into sales.
The second campaign may end up with a lower CAC despite looking more expensive at the lead stage.
This is why I do not optimize lead-generation campaigns on CPL alone.
I Need Lead-to-Sale Rate to Understand CAC Properly
For lead-generation businesses, one of the most useful performance marketing KPIs is the lead-to-sale conversion rate.
If that rate improves, the business may be able to tolerate a higher CPL while still reducing CAC.
That changes how I judge campaign quality.
For example:
Campaign A: ₹200 CPL with 2% lead-to-sale conversion.
Campaign B: ₹350 CPL with 8% lead-to-sale conversion.
Campaign B may look worse in Ads Manager and still be much better for the business.
I Compare CAC With Customer Value
CAC becomes useful only when I compare it with what the customer is worth.
If I acquire a customer for ₹1,500 and the business earns ₹8,000 in contribution from that customer over time, the economics may be very healthy.
If I acquire a customer for ₹1,500 but only make ₹1,700 before other costs, I have very little room.
That is why CAC and LTV should eventually be looked at together.
I Also Care About Payback Period
This matters especially when the business earns customer value over time.
A CAC of ₹3,000 may be completely acceptable if the business recovers that money quickly and the customer continues generating revenue afterward.
The same CAC may be uncomfortable if it takes 12 months to recover.
So I do not look only at how much the customer costs.
I also want to know how quickly that acquisition cost comes back.
I Watch CAC Much More Closely When Scaling
A campaign can look excellent at low spend and then become much more expensive as the budget rises.
That is normal to some extent.
The question is how much deterioration the economics can tolerate.
If CAC moves from ₹1,000 to ₹1,150 while customer volume increases significantly, I may be perfectly happy.
If it moves from ₹1,000 to ₹2,000 while the business can only support ₹1,400, I have a problem.
This is why I think about CAC as a scaling guardrail rather than a metric that must remain perfectly flat.
I Pay Attention to Marginal CAC
Blended CAC can hide what the next layer of growth is actually costing.
Suppose the first ₹5 lakh of spend acquires customers at ₹1,000 CAC.
The business then increases spend to ₹8 lakh and blended CAC rises to ₹1,150.
That blended number may still look healthy.
But I want to know what CAC the additional ₹3 lakh produced.
That tells me whether the latest increase in spend is still creating efficient incremental growth.
I Use CAC to Compare Channels More Fairly
Meta may produce cheaper leads.
Google may produce fewer but higher-intent leads.
YouTube may generate large volume that converts more slowly.
If I compare only CPL or platform CPA, one channel can look clearly better.
If I compare real customer acquisition cost, the ranking can change completely.
This is one of the reasons I try to connect CRM or business data back to paid media when I conduct a performance marketing audit.
I Do Not Use a Universal “Good CAC” Benchmark
A good CAC depends on the economics of the specific business.
₹5,000 CAC may be excellent for a high-ticket service.
It may be impossible for a low-margin ecommerce product.
I want the target CAC derived from customer value, margin, conversion rate, repeat behaviour and payback period.
That is much more useful than copying a benchmark from another company or industry.
My Rule for CAC Is Simple
I use CAC to answer:
“How much are we really paying to acquire the customer the business actually wants?”
Then I compare that cost with customer value and the economics required for growth.
If CAC is healthy and there is room to scale, I look for more volume.
If CAC deteriorates, I use CPL, CVR, CTR, CPC, CPM and lead quality to diagnose why.
That is why CAC sits near the top of my performance marketing measurement hierarchy.
CPL: A Useful Lead Generation Metric, but Never the Final Answer
Cost per lead is one of the metrics I have worked with the most across lead-generation campaigns.
It is useful because it tells me how efficiently the campaign is turning advertising spend into enquiries.
But I have also seen CPL become one of the most misleading performance marketing metrics when it is treated as the final measure of success.
For me, the real question is not:
“How cheap are the leads?”
It is:
“What kind of leads are we buying, and what happens to them after they enter the funnel?”
I Start With the Basic CPL Formula
The calculation is straightforward:
CPL = Advertising Spend ÷ Number of Leads Generated
If a campaign spends ₹1 lakh and generates 500 leads, CPL is ₹200.
That gives me a useful acquisition metric.
But by itself, it tells me nothing about whether those 500 leads were actually valuable.
I Never Compare CPL Without Understanding the Conversion Definition
This is one of the first things I check.
What exactly counts as a lead?
A completed form?
An instant form submission?
A WhatsApp enquiry?
A phone call?
A booked consultation?
A webinar registration?
Those are very different actions.
A ₹100 CPL for a basic registration cannot be compared directly with a ₹500 CPL for a qualified consultation request.
The conversion definition has to come before the benchmark.
Cheap CPL Can Attract Weak Intent
I have seen campaigns become cheaper because the creative became broader, the targeting expanded or the form became easier to submit.
On the dashboard, performance improved.
Then the sales team started complaining.
People were less serious.
Contact rates dropped.
Qualification weakened.
Sales did not improve at the same pace as lead volume.
That is why I never assume a falling CPL automatically means the campaign is getting better.
I Compare CPL With Lead Quality
Whenever possible, I want to break lead quality down by source.
Suppose Meta generates leads at ₹250 and Google generates leads at ₹450.
If I stop at CPL, Meta looks clearly stronger.
But if Google leads qualify and close at a much higher rate, paying ₹450 may be completely rational.
This is one of the reasons I try to connect CRM and sales data back to campaigns when I conduct a performance marketing audit.
I Look at Qualified CPL When the Data Exists
One of the simplest ways to improve lead-generation measurement is to move one step deeper.
Instead of only tracking cost per lead, I also want to know:
Cost per qualified lead.
If 1,000 leads were generated but only 200 are genuinely qualified, the acquisition economics look very different.
This can completely change which campaign I consider the winner.
Lead-to-Sale Conversion Changes How I Judge CPL
I usually want to connect CPL with the percentage of leads that eventually become customers.
For example:
Campaign A: ₹200 CPL and 2% lead-to-sale conversion.
Campaign B: ₹400 CPL and 8% lead-to-sale conversion.
Campaign B has twice the CPL.
But the cost to acquire an actual customer can still be dramatically lower.
This is why I see CPL as a funnel metric and CAC as the stronger business metric whenever the sales data is available.
I Watch CPL by Creative, Audience and Search Intent
CPL becomes much more useful when I break it down.
On Meta, I may compare CPL by creative angle or audience.
On Google, I may compare CPL by search theme or keyword intent.
On YouTube, I may compare CPL by audience and video creative.
That helps me understand what is driving efficiency instead of treating the account average as one number.
I Compare CPL With Conversion Rate
If CPL increases, I want to know why.
Maybe CPC increased.
Maybe conversion rate fell.
Maybe both happened.
Those causes lead to very different actions.
If CPC is stable but CVR falls, I may look at the landing page or traffic quality.
If CVR is stable but CPC rises, I may investigate competition, CPM, CTR or search auction pressure.
This is why I never diagnose CPL independently from the rest of the funnel.
I Look at Scale Alongside CPL
A very low CPL at tiny volume does not automatically impress me.
I want to know how much spend and lead volume sit behind the number.
For example, one education YouTube campaign I worked on generated more than 66,300 leads at approximately ₹76 CPL from around ₹50.4 lakh in spend.
The CPL is useful, but the scale gives that number context.
Similarly, in my Ayurveda Google Ads case study, Google Ads generated more than 5,000 leads at approximately ₹87.65 CPL from around ₹4.41 lakh in spend.
Those numbers are more meaningful to me because they include both efficiency and volume.
I Do Not Expect CPL to Stay Flat Forever While Scaling
As spend increases, CPL can rise.
That does not automatically mean the scaling attempt failed.
If the business can still acquire customers profitably and lead quality remains healthy, I may accept a higher CPL in exchange for significantly more volume.
The right question is whether the additional leads are still economically useful.
I Also Look at Sales Capacity
This is easy to overlook.
A campaign can generate a fantastic CPL and still create a poor business outcome if the sales team cannot handle the volume.
If response times become slower because lead volume suddenly doubles, close rate can fall.
At that point, the marketing campaign may not be the main problem.
The business may have an operational bottleneck.
I Do Not Use Universal CPL Benchmarks
I am very cautious when someone asks me, “What is a good CPL?” without giving any other context.
A ₹100 CPL may be expensive for one business.
A ₹2,000 CPL may be excellent for another.
The right CPL depends on:
- Lead quality
- Lead-to-sale conversion
- Customer value
- Gross margin
- Sales cycle
- Channel
- Offer
- Scale
That is why I prefer calculating the allowable CPL backward from customer economics rather than borrowing a benchmark from another account.
My Rule for CPL Is Simple
CPL tells me how efficiently I am buying leads.
It does not tell me whether I am buying good leads.
So I use CPL together with qualified lead rate, lead-to-sale conversion and CAC.
If CPL improves and downstream quality stays healthy, that is useful progress.
If CPL improves while sales quality collapses, I do not call that better performance.
For me, the best CPL is not the lowest number.
It is the cost at which the business can generate enough qualified demand that eventually turns into profitable customers.
CVR: The Metric I Use to Understand Whether the Funnel Is Converting Traffic Properly
Conversion rate is one of the most useful performance marketing metrics because it tells me what happens after the click.
If CTR is healthy and CPC is reasonable but CPL or CAC is getting worse, CVR is one of the first places I look.
For me, conversion rate helps answer:
“Are we buying the wrong traffic, or are we failing to convert the traffic we already have?”
I Start With the Basic Conversion Rate Formula
The simple formula is:
CVR = Conversions ÷ Clicks × 100
If 1,000 people click an ad and 50 convert, the conversion rate is 5%.
That calculation is simple.
The interpretation is not.
A 5% CVR can be excellent in one funnel and weak in another.
The traffic source, offer, price, conversion action and customer intent all matter.
I Never Look at CVR Without Looking at Traffic Quality
This is probably the most important thing I keep in mind.
A falling conversion rate does not automatically mean the landing page is getting worse.
The traffic may have changed.
Google may be matching into broader search intent.
Meta may be expanding beyond the strongest audience.
YouTube may be reaching people who are interested enough to click but not ready to convert.
So before I blame the page, I compare traffic quality with the period when CVR was stronger.
I Look at CVR by Channel
I do not expect Meta, Google and YouTube traffic to convert at the same rate.
Google Search users may already be actively looking for the solution.
Meta users may discover the offer while scrolling.
YouTube viewers may need more education before they are ready to act.
That means the same landing page can produce very different conversion rates by source.
I want to understand those differences rather than force one universal CVR benchmark across every channel.
I Look at CVR by Device
This is another area where useful insights can appear very quickly.
If desktop converts at 7% and mobile converts at 2%, I want to understand why.
Maybe the mobile page is slow.
Maybe the form is difficult to complete.
Maybe important proof sits too far down the page.
Maybe a pop-up is blocking the CTA.
When most paid traffic is mobile, even a relatively small mobile conversion problem can have a large impact on CPL and CAC.
I Compare CVR Before and After Landing Page Changes
If performance drops after a website redesign, I do not assume the new page is better because it looks cleaner.
I compare the numbers.
A new headline may weaken message match.
A longer form may create more friction.
A redesign may move the strongest proof lower on the page.
A checkout change may add unnecessary steps.
If conversion rate deteriorated immediately after a major page change, that becomes a strong area to investigate.
I Look at CVR Together With CPC
CPC and CVR together explain a large part of CPL and CPA movement.
If CPC rises while CVR stays stable, the problem is probably happening before the landing page.
If CPC stays stable but CVR falls, I move further down the funnel.
If both CPC and CVR deteriorate, I may be dealing with multiple problems at the same time.
This is why I like using performance marketing KPIs as a system rather than judging each metric independently.
I Use CVR to Understand Whether CRO Can Improve Acquisition Economics
This is where conversion rate becomes directly useful for scaling.
If I can improve CVR without increasing CPC, CAC can improve without changing the media buying.
For example, suppose CPC is ₹20.
At a 2% conversion rate, 100 clicks cost ₹2,000 and generate 2 conversions.
That means the front-end cost per conversion is ₹1,000.
If the same traffic converts at 4%, the same ₹2,000 generates 4 conversions.
The cost per conversion falls to ₹500 without CPC changing at all.
That is why CRO can create just as much value as another round of campaign optimization.
I go deeper into that relationship in my performance marketing audit framework.
I Separate Landing Page CVR From Downstream Conversion
For lead generation, getting the form submission is only one conversion rate.
I may also want to know:
- Visitor-to-lead conversion rate
- Lead-to-qualified-lead conversion rate
- Qualified-lead-to-sale conversion rate
- Lead-to-customer conversion rate
Those numbers help me understand where the funnel is really losing efficiency.
A page can have excellent visitor-to-lead CVR and still create poor customer acquisition economics if lead quality is weak.
For Ecommerce, I Look Beyond the Product Page
Ecommerce conversion rate can hide several different stages.
I may look at:
- Product-page-to-add-to-cart rate
- Add-to-cart-to-checkout rate
- Checkout-to-purchase rate
- Overall session-to-purchase conversion rate
If add-to-cart is healthy but purchases are weak, the problem may be checkout, payment, shipping or trust rather than traffic quality.
Breaking the funnel into stages makes CVR much more useful.
I Do Not Chase Higher CVR at Any Cost
This is important.
I can sometimes increase conversion rate by making the offer broader, reducing qualification or lowering friction too aggressively.
But if that creates weaker leads or lower-value customers, the higher CVR may not help the business.
I want conversion rate improving together with customer quality.
I Do Not Use Universal CVR Benchmarks
When someone asks, “What is a good conversion rate?” I usually want more context first.
A high-intent Google Search landing page should behave differently from a cold Meta funnel.
A ₹499 digital product should behave differently from a ₹50,000 service.
A simple lead form should behave differently from a multi-step application.
So I compare conversion rate against:
- The same funnel historically
- The same traffic source
- The same device
- The same offer
- The same audience type
That gives me a much more useful benchmark than copying an industry average.
My Rule for Conversion Rate Is Simple
CVR tells me how efficiently the funnel is turning traffic into the action I care about.
If conversion rate falls, I want to know whether traffic quality changed or whether the conversion experience got worse.
If conversion rate improves, I want to know whether the additional conversions are still high quality.
For me, the best conversion rate is not the highest percentage.
It is the rate that helps the business turn paid traffic into qualified customers at sustainable acquisition economics.
LTV: The Metric That Changes How Much I Am Willing to Pay for Acquisition
Customer lifetime value is where performance marketing starts moving beyond the first conversion.
If I only look at what happens on day one, I can easily underinvest in customers who become much more valuable over time.
That is why LTV is one of the most important performance marketing metrics for businesses with repeat purchase, subscription or recurring revenue.
The question I am trying to answer is:
“What is this customer realistically worth over the relationship, not just on the first transaction?”
I Do Not Use LTV as a Fantasy Number
This is the first thing I want to make clear.
I am very cautious with inflated lifetime value assumptions.
If someone tells me a customer has ₹20,000 LTV because that is what they hope the customer will eventually spend, I do not use that number to justify a high CAC.
I want LTV based on actual customer behaviour.
How often do customers return?
How long do they stay?
How much do they spend?
What margin remains on those repeat purchases?
That is the data I want.
The Simple LTV Formula Depends on the Business Model
There is no single lifetime value formula that fits every business perfectly.
For a simple repeat-purchase ecommerce model, I may think about it roughly as:
LTV = Average Order Value × Average Purchase Frequency × Customer Lifespan
For a subscription business, I may look more closely at monthly revenue per customer, retention and churn.
For a service business, I may look at average contract value and repeat or renewal behaviour.
The exact calculation matters less to me than whether it represents real customer economics.
LTV Changes the CAC I Can Tolerate
Suppose two businesses both acquire a customer for ₹2,000.
Business A makes ₹2,500 in total contribution from that customer.
Business B makes ₹10,000 over the customer’s lifetime.
The same ₹2,000 CAC means something completely different in those two businesses.
Business B may have much more room to spend aggressively on acquisition.
This is why I do not evaluate CAC without understanding customer value.
I Look at LTV:CAC, but I Do Not Worship the Ratio
A common way to connect the two metrics is:
LTV:CAC = Customer Lifetime Value ÷ Customer Acquisition Cost
If LTV is ₹9,000 and CAC is ₹3,000, the ratio is 3:1.
That gives me a useful directional view.
But I still want to know how quickly the value is realised.
A 3:1 ratio can look attractive while creating cash-flow pressure if it takes two years to earn the revenue.
That is why I usually look at payback period alongside LTV:CAC.
Payback Period Matters Because Cash Flow Matters
Imagine I acquire a customer for ₹5,000.
If I recover that ₹5,000 in two months and the customer continues producing value afterward, scaling may be relatively comfortable.
If it takes 14 months to recover the same acquisition cost, the business needs much more working capital to keep growing.
So when I use LTV in performance marketing decisions, I want to know not only how much value comes back, but also when it comes back.
LTV Can Make a Lower First-Order ROAS Completely Rational
This is where people sometimes misunderstand ecommerce or subscription acquisition.
A business may intentionally accept a lower first-order ROAS if repeat purchase economics are strong.
If the first purchase nearly covers acquisition cost and the customer has a high probability of buying again, the business may still have excellent economics.
That does not mean I ignore first-order performance.
It means I judge it in the context of the full customer relationship.
I Separate New-Customer Acquisition From Retention
LTV becomes much more useful when I can understand the behaviour of newly acquired customers separately.
I want to know whether customers coming from Meta behave differently from customers coming from Google.
I want to know whether one creative angle attracts customers who repeat more often.
I want to know whether discount-heavy acquisition creates weaker long-term customer value.
If the data is available, those differences can influence where I allocate budget.
High LTV Does Not Automatically Mean I Should Pay Any CAC
This is another mistake I avoid.
A business can have strong lifetime value and still overpay for acquisition.
I want enough margin between LTV and CAC to cover operating costs, risk and the fact that future customer behaviour is never perfectly predictable.
The goal is not to spend up to the absolute theoretical limit.
The goal is to acquire customers at economics that leave the business healthy.
I Revisit LTV as the Business Changes
LTV is not a number I calculate once and keep forever.
Retention changes.
Pricing changes.
Product mix changes.
Repeat purchase behaviour changes.
Different cohorts can behave very differently.
If I am using lifetime value to justify higher acquisition costs, I want the underlying data refreshed regularly.
LTV Becomes Especially Powerful When Connected With Acquisition Source
This is where performance marketing measurement becomes much more interesting.
Suppose Meta acquires customers at ₹1,500 CAC and Google acquires them at ₹2,000 CAC.
Meta looks better initially.
But if Google customers have materially higher repeat purchase behaviour and stronger lifetime value, the more expensive acquisition may still be the better investment.
That is why I try to connect channel data with customer behaviour instead of evaluating acquisition only from the first conversion.
This Is Also Why Retention Affects Paid Media Strategy
If email, WhatsApp, subscriptions or replenishment improve repeat purchase behaviour, that can increase LTV.
If LTV increases, allowable CAC may increase too.
That can give me more room to scale paid acquisition.
So retention is not separate from performance marketing economics.
It directly affects how aggressively I can buy customers.
I Use LTV Most Carefully When Scaling
When a business starts accepting a higher CAC because of lifetime value, I want to make sure that the additional customers behave like the historical customers used to calculate LTV.
That matters because broader audiences can sometimes bring weaker retention.
The LTV of the first 1,000 customers may not remain identical when the business scales to the next 10,000.
I want to watch cohort quality instead of assuming historical LTV will always hold.
My Rule for LTV Is Simple
LTV tells me how much economic room I may have beyond the first transaction.
I use it to understand allowable CAC, payback, retention and how aggressively the business can scale.
But I only trust LTV when it comes from real customer behaviour.
For me, the useful question is not:
“How high can we make the LTV number look?”
It is:
“How much value do customers actually create over time, and how much of that value can we safely invest back into acquiring more of them?”
CTR, CPC and CPM: The Diagnostic Metrics I Use to Explain Why Performance Changed
CTR, CPC and CPM are not the metrics I use to define whether a business is winning.
But they are extremely useful when I am trying to understand why CPL, CPA, CAC or ROAS changed.
I think of them as diagnostic performance marketing metrics.
They help me identify where the problem may have started.
CTR Tells Me Whether the Ad Is Getting the Right Attention
CTR is simply the percentage of people who click after seeing the ad.
The basic formula is:
CTR = Clicks ÷ Impressions × 100
If 100,000 impressions generate 2,000 clicks, the CTR is 2%.
But I do not look at CTR and immediately decide whether the creative is good or bad.
I want context.
A Higher CTR Is Not Automatically Better
This is one of the easiest mistakes to make.
I can create a sensational hook that generates a lot of clicks.
CTR goes up.
CPC may even go down.
But if those users do not convert or the leads are poor quality, the stronger CTR did not improve the business outcome.
That is why I always connect CTR with CVR, CPL, lead quality and CAC.
When CTR Drops, I Start Asking Creative Questions
If CPM is relatively stable but CTR falls, I usually look at the ad itself before making major targeting changes.
I ask:
- Has the hook weakened?
- Has the same creative been running too long?
- Has frequency increased?
- Has the audience become broader?
- Has the offer changed?
- Is the creative still relevant to the audience receiving the spend?
A falling CTR can be an early signal of creative fatigue, but I do not assume that automatically.
CPC Helps Me Understand the Cost of Getting Traffic Into the Funnel
The basic formula is:
CPC = Ad Spend ÷ Clicks
If I spend ₹50,000 and generate 5,000 clicks, average CPC is ₹10.
CPC becomes useful when I connect it with conversion rate.
If CPC rises but CVR remains stable, CPL or CPA will usually rise too.
If CPC stays stable but CPL gets worse, the problem is probably happening after the click.
That simple comparison saves me from changing the wrong part of the funnel.
I Do Not Always Chase the Cheapest CPC
Cheap traffic is not automatically good traffic.
I would rather pay ₹30 for a click that has strong commercial intent than ₹10 for a click that almost never converts.
This is especially obvious in Google Ads.
A broader informational query may produce cheaper clicks than a high-intent commercial search.
But the expensive click may be much more valuable.
That is why CPC has to be judged through downstream conversion quality.
CPM Tells Me What It Costs to Reach the Market
CPM is the cost to generate 1,000 impressions.
The basic formula is:
CPM = Ad Spend ÷ Impressions × 1,000
CPM is especially useful on platforms such as Meta and YouTube because it gives me a sense of how expensive the available audience has become.
If CPM rises sharply while CTR and CVR remain stable, acquisition cost can increase even though nothing is obviously wrong with the creative or landing page.
I Do Not Assume High CPM Means the Campaign Is Bad
A high CPM can still be perfectly acceptable if the audience is valuable enough.
For example, a narrow high-value audience may be more expensive to reach but convert much better.
I care about the economics after the impression.
If higher CPM still produces acceptable CAC, I may continue spending.
I Use CPM, CTR and CPC Together
These metrics become much more useful when I read them as a sequence.
For example:
CPM up, CTR stable, CVR stable: I may be dealing with more expensive inventory or competition.
CPM stable, CTR down: I start looking at creative, fatigue or audience relevance.
CTR strong, CPC healthy, CVR down: I move toward the landing page, offer or traffic quality.
CTR down and CPM up: I may be dealing with both creative weakness and more expensive delivery.
This is exactly how I use these numbers during a performance marketing audit.
I Look at Frequency Alongside CTR on Meta
Frequency becomes especially useful when performance starts declining after a creative has been running for some time.
If frequency keeps rising while CTR gradually falls, I start taking creative fatigue more seriously.
But if frequency is low and CTR still drops, I look for other explanations.
Maybe the audience changed.
Maybe the offer weakened.
Maybe Meta shifted delivery toward a different user segment.
For YouTube, I Add View Metrics to the Diagnosis
YouTube requires a slightly different set of supporting metrics.
I may look at view rate, CPV, clicks and downstream conversion together.
A video can have excellent view rate and still produce weak business performance.
That is why I do not confuse engagement with acquisition.
I have gone deeper into this specifically in my YouTube Ads metrics guide.
I Compare Diagnostic Metrics With Their Own Historical Baseline
I am usually much more interested in how CTR, CPC and CPM changed inside the same account than whether they match some generic benchmark from the internet.
If an account historically ran at 2.5% CTR and suddenly drops to 1.4%, that movement matters.
If CPC normally sits around ₹20 and suddenly jumps to ₹35, I want to know why.
The account’s own history often gives me a much more useful reference point than an industry average.
My Rule for CTR, CPC and CPM Is Simple
I do not optimize these metrics because I want prettier dashboard numbers.
I use them to diagnose movement in the acquisition system.
If CAC rises, these metrics help me trace where the deterioration may have started.
If CAC improves, they help me understand what changed so I can try to repeat it.
For me, CTR, CPC and CPM are most valuable when they help explain the bigger performance marketing KPIs rather than becoming goals by themselves.
MER and Blended CAC: How I Check Whether Platform Performance Matches the Business
Once a business is spending across Meta, Google, YouTube and other channels, I stop trusting any single platform to tell me the complete acquisition story.
Each platform has its own attribution system.
Meta may claim revenue.
Google Ads may claim some of the same revenue.
GA4 may attribute the customer differently again.
That is why I also use blended performance marketing metrics such as MER and blended CAC.
They help me answer a much bigger question:
“Is the business actually becoming more efficient as a whole?”
MER Gives Me a Business-Level View of Advertising Efficiency
MER is usually calculated as:
MER = Total Revenue ÷ Total Marketing or Advertising Spend
If a business generates ₹40 lakh in revenue after spending ₹10 lakh on paid acquisition, MER is 4X.
Unlike platform ROAS, MER does not care which platform claims the conversion.
It simply compares the money going into acquisition with the revenue coming back to the business.
I Use MER to Sanity-Check Platform ROAS
Suppose Meta reports 5X ROAS and Google Ads reports 6X ROAS.
That sounds fantastic.
But if total paid media spend is ₹10 lakh and the business generated only ₹30 lakh in total revenue, something does not add up if I treat both platform numbers as completely incremental.
The platforms may be claiming overlapping conversions.
Brand demand may be contributing heavily.
Existing customers may be included.
This does not mean the platform reporting is useless.
It means I need another level of measurement.
I Still Use Platform ROAS for Optimization
I do not replace platform reporting with MER.
They answer different questions.
Platform ROAS helps me make decisions inside Meta Ads or Google Ads.
MER helps me understand whether the entire acquisition system is producing enough revenue relative to spend.
I usually want both views.
Blended CAC Does the Same Thing From a Customer Perspective
If I have reliable new-customer data, I also like looking at blended CAC.
A simple version is:
Blended CAC = Total Acquisition Spend ÷ Total New Customers Acquired
If the business spends ₹12 lakh across all acquisition channels and acquires 800 new customers, blended CAC is ₹1,500.
This gives me a business-level acquisition cost without depending on which platform received attribution credit.
Platform CPA and Blended CAC Can Tell Very Different Stories
Imagine Meta reports ₹1,000 cost per purchase and Google reports ₹1,100.
If I look only at those numbers, acquisition appears very efficient.
But if actual business data shows blended new-customer CAC at ₹1,700, I want to understand the gap.
There may be attribution overlap.
Some reported purchases may be returning customers.
There may be cancellations or failed payments.
Or the platforms may simply be measuring conversions differently.
That gap itself becomes useful information.
I Prefer New-Customer MER When the Business Can Measure It
Total MER can also be misleading when a mature brand has significant repeat revenue.
Imagine a business spends ₹10 lakh on advertising and generates ₹50 lakh in total revenue.
MER is 5X.
But if ₹30 lakh came from existing customers who may have purchased anyway, the acquisition picture looks different.
When the data is available, I like separating:
- Total revenue
- New-customer revenue
- Returning-customer revenue
- Total MER
- New-customer acquisition efficiency
That helps me understand whether paid marketing is genuinely expanding the customer base.
MER Becomes More Useful as Channel Mix Gets More Complicated
If a business only runs one paid channel, platform reporting may already provide a reasonably useful directional view.
But once Meta, Google Search, Performance Max, YouTube, affiliates and other channels are active together, blended measurement becomes much more important.
The more touchpoints involved in a conversion, the harder it becomes to assign perfect credit to one platform.
At that point, I care increasingly about whether total acquisition economics are improving.
I Watch the Trend More Than One Isolated MER Number
I usually care more about how MER changes over time than whether it hits some universal benchmark.
Suppose the business historically operates around 3.5X MER.
Spend increases by 40% and MER moves to 3.3X while revenue grows significantly.
That may be completely healthy if the economics still work.
If spend increases by 40% and MER collapses to 2X, I want to investigate much more closely.
I Compare MER With Margin
Just like ROAS, MER does not tell me profitability by itself.
A 4X MER can be excellent for one business and unsustainable for another.
I still need to know:
- Gross margin
- Discounts
- Fulfilment cost
- Payment fees
- Returns or cancellations
- Customer support or sales costs where relevant
The ratio becomes useful only when I understand the economics sitting underneath the revenue.
I Use Blended Metrics When Platforms Disagree
This happens frequently.
Meta may say performance improved.
Google may say performance improved too.
But Shopify, the CRM or total revenue may tell a weaker story.
When that happens, I move upward from channel-level attribution and look at the business totals.
That is also why tracking and attribution are one of the first things I investigate in my performance marketing audit framework.
Blended Metrics Are Especially Useful When Scaling
When I increase spend, I want to know whether the additional platform conversions are actually appearing in the business numbers.
If Meta spend increases by ₹5 lakh and Meta reports much more revenue, I want to see whether total revenue and new-customer volume move in the same direction.
If platform results improve but the overall business barely moves, I become cautious about putting more money behind the reported ROAS.
I Do Not Expect Perfect Attribution
I do not think the goal is to create one attribution model that perfectly explains every customer journey.
That is rarely realistic.
Instead, I use multiple views.
Platform metrics help me optimize campaigns.
GA4 and analytics data help me understand journeys and traffic behaviour.
CRM or ecommerce data helps me understand actual customers and revenue.
MER and blended CAC help me check whether the overall economics make sense.
My Rule for MER and Blended CAC Is Simple
I use platform data to decide what to change inside the channel.
I use blended data to decide whether the acquisition system is actually working for the business.
If Meta, Google and YouTube all look strong and the business numbers agree, I have much more confidence in the performance.
If the platform dashboards look fantastic but blended CAC keeps rising and MER keeps deteriorating, I know I need to investigate deeper before scaling further.
How I Read Performance Marketing Metrics Together When Results Change
This is where the numbers become useful.
I do not look at ROAS, CAC, CPL, CVR, CTR, CPC or CPM as separate dashboard metrics.
I connect them.
When performance changes, I normally work backward through the funnel until I find the point where the numbers started behaving differently.
That helps me avoid changing the wrong thing.
If CAC Goes Up, I Do Not Start by Blaming the Campaign
Suppose customer acquisition cost increases by 30%.
My first question is not:
“Which campaign should I switch off?”
I want to understand what created the CAC increase.
So I start breaking the movement down.
Did CPL increase?
Did lead-to-sale conversion fall?
Did CPC rise?
Did CVR fall?
Did lead quality change?
Did sales follow-up become slower?
Once I know which part changed, the next action becomes much clearer.
Scenario 1: CPM Increases, but Everything Else Is Stable
Suppose I see:
- CPM increasing
- CTR remaining stable
- CVR remaining stable
- CPC increasing
- CPL increasing
That tells me the campaign may simply be paying more to reach the same type of audience.
I may investigate auction competition, audience saturation, seasonality or changes in inventory.
I would not immediately rebuild the landing page because the funnel after the click is still behaving normally.
Scenario 2: CPM Is Stable, but CTR Falls
Now suppose:
- CPM is stable
- CTR falls
- CPC rises
- CVR remains stable
- CPL increases
That pushes me toward the creative or audience relationship.
The ad may not be getting the same response anymore.
I may look at creative fatigue, hook strength, offer relevance, audience expansion or frequency.
Again, the landing page is probably not where I start.
Scenario 3: CTR and CPC Look Healthy, but CVR Falls
This is a very different problem.
If I see:
- CTR stable
- CPC stable
- Traffic volume stable
- CVR falling
- CPL or CPA rising
I move further down the funnel.
I want to check:
- Landing page changes
- Page speed
- Mobile experience
- Form or checkout issues
- Offer changes
- Traffic quality
- Tracking problems
The media buying may still be doing its job.
The conversion experience may be where the deterioration started.
Scenario 4: CPL Improves, but CAC Gets Worse
This is one of the most important patterns in lead generation.
Suppose CPL falls from ₹400 to ₹250.
At first glance, that looks like a major improvement.
But then customer acquisition cost rises.
That tells me the problem is probably happening after the lead is generated.
I want to know whether:
- Lead quality fell
- Qualification rate declined
- Lead-to-sale conversion dropped
- Sales response time became slower
- The campaign started attracting lower-intent users
This is why I never evaluate lead-generation performance on CPL alone.
Scenario 5: ROAS Falls, but CAC Is Stable
This can happen in ecommerce.
If customer acquisition cost stays stable but ROAS drops, I start looking at revenue per customer.
Maybe AOV fell.
Maybe the product mix changed.
Maybe discounts increased.
Maybe customers are buying cheaper products.
In that situation, the acquisition engine may still be acquiring customers efficiently.
The revenue side may be what changed.
Scenario 6: ROAS Looks Strong, but New-Customer CAC Is Getting Worse
This is another pattern I take seriously.
It can happen when returning customers contribute more revenue or when remarketing becomes a larger share of the account.
Total ROAS stays healthy.
But the cost of acquiring new customers keeps increasing.
If the business is trying to grow its customer base, I do not want the strong blended ROAS to hide that problem.
Scenario 7: Platform Performance Improves, but MER Gets Worse
This is where I become cautious about attribution.
Suppose Meta reports better ROAS.
Google Ads reports better ROAS too.
But total business revenue does not increase in line with spend and MER deteriorates.
That tells me I need to step outside the ad platforms.
I may investigate:
- Attribution overlap
- Brand and remarketing contribution
- Returning-customer revenue
- Tracking changes
- Incremental customer growth
I do not automatically assume the platforms are wrong.
But I do want the platform story and the business story to make sense together.
Scenario 8: CVR Improves, but Lead Quality Falls
A higher conversion rate can look like a clear win.
But imagine a landing page change increases CVR from 6% to 10% while qualified lead rate falls sharply.
The page may have become easier to convert on, but worse at filtering intent.
That means I need to evaluate the change further down the funnel.
The goal is not maximum CVR.
The goal is profitable customer acquisition.
Scenario 9: CAC Is Stable, but Scale Is Not Increasing
This tells me something different again.
The economics may be healthy, but the channel may have a volume constraint.
I might investigate:
- Budget limitations
- Audience size
- Search volume
- Creative capacity
- Landing-page capacity
- Sales capacity
- Product availability
A stable CAC does not automatically mean there is unlimited room to spend more.
Scenario 10: Every Metric Looks Fine, but Revenue Is Still Weak
This is when I question whether the metrics being optimized are close enough to the actual business outcome.
Maybe the campaign is optimizing for leads instead of qualified opportunities.
Maybe the purchase value being passed into the ad platform is inaccurate.
Maybe repeat customers are inflating reported performance.
Maybe the sales process is the real bottleneck.
If every marketing metric looks good while the business result is weak, I do not keep polishing the dashboard.
I move closer to revenue.
I Use a Simple Diagnostic Chain
When acquisition performance deteriorates, I usually think through the metrics in this order:
Business outcome → CAC or ROAS → CPL or CPA → CVR → CPC → CTR → CPM
For lead generation, I add:
Lead quality → Qualified lead rate → Lead-to-sale rate → CAC
For ecommerce, I may add:
AOV → New-customer CAC → Repeat purchase → LTV → Contribution margin
This gives me a structured way to diagnose the problem instead of randomly changing campaigns.
The Most Important Metric Is Usually the One Closest to the Business Outcome
If I have reliable CAC, I prefer it over CPL.
If I have reliable customer contribution, I prefer that over gross revenue alone.
If I have qualified lead data, I prefer that over raw form submissions.
If I have new-customer revenue, I prefer understanding that separately from blended revenue.
The closer I can get measurement to the actual business outcome, the better my performance marketing decisions usually become.
This is also how I approach account diagnosis as a performance marketing consultant.
My Rule Is to Diagnose Before I Optimize
When a performance marketing KPI moves, I want to understand the chain of numbers that created that movement.
Only then do I decide what to change.
That is much more reliable than seeing CPL rise and immediately changing targeting, or seeing ROAS fall and immediately cutting budgets.
The metrics are not just reporting numbers.
Used properly, they are a diagnostic system for deciding where the next improvement should come from.
Which Performance Marketing Metrics Matter Most Depends on the Business Model
I do not use the same performance marketing KPI hierarchy for every business.
The metric I prioritize depends on how the business makes money, how quickly customers convert and where the real economic value appears in the funnel.
This is why I am cautious when someone asks me:
“What is the most important performance marketing metric?”
There is no single answer that works for every business.
For Ecommerce, I Usually Prioritize New-Customer CAC and Contribution
For ecommerce, platform ROAS is useful, but I normally want to get closer to the economics of acquiring a new customer.
My measurement stack may include:
- New-customer CAC
- New-customer revenue
- ROAS
- MER
- AOV
- Conversion rate
- Contribution margin
- Repeat purchase rate
- LTV
If I am scaling aggressively, new-customer CAC becomes especially important.
I want to know whether the business is actually acquiring more customers or simply generating additional revenue from people who already know the brand.
AOV Can Completely Change Ecommerce ROAS
This is one reason I do not treat falling ROAS as automatically an advertising problem.
If CAC remains stable but average order value drops, ROAS can deteriorate even though acquisition efficiency has not changed much.
That may push me toward bundles, upsells, product mix or merchandising rather than immediately changing the campaigns.
For Lead Generation, CPL Is Only the Beginning
For a lead-generation business, I may start with CPL because it is the fastest acquisition metric available.
But the metrics I really want are:
- Cost per lead
- Qualified lead rate
- Cost per qualified lead
- Contact rate
- Lead-to-opportunity rate
- Lead-to-sale conversion rate
- Customer acquisition cost
- Revenue per lead
The further I can move measurement toward actual sales, the more confidently I can allocate budget.
I Care About Revenue per Lead More Than Most Teams Expect
Revenue per lead can be a very useful metric when lead sources have different quality levels.
Suppose one channel generates leads at ₹200 CPL and another at ₹400.
The first looks better.
But if the ₹400 leads generate three times as much revenue per lead, I may happily pay the higher acquisition cost.
That is why I try to move beyond raw lead volume whenever CRM data is available.
For High-Ticket Services, Opportunity Quality Matters More Than Volume
If the business sells a high-ticket service, a cheap CPL can become almost irrelevant.
I may care much more about:
- Qualified opportunities
- Cost per booked call
- Show-up rate
- Proposal rate
- Close rate
- CAC
- Average contract value
One excellent opportunity may be worth more than 100 weak leads.
So I am usually willing to accept a higher CPL if the leads are materially closer to becoming customers.
For Subscription Businesses, First-Purchase ROAS Can Be Misleading
A subscription business often requires a different way of thinking.
I may pay close attention to:
- CAC
- Trial-to-paid conversion
- Monthly recurring revenue
- Retention
- Churn
- Payback period
- LTV
- LTV:CAC
The first transaction may not tell me whether the acquisition is profitable.
I need to understand how long customers stay and how quickly acquisition cost is recovered.
For Digital Products, I Look at Front-End Economics and the Full Funnel
Digital products can look extremely profitable because fulfilment costs are often lower than physical ecommerce.
But I still want to understand the entire funnel.
I may track:
- Front-end CPA
- Front-end ROAS
- Landing-page conversion rate
- Order-bump take rate
- Upsell conversion rate
- Revenue per buyer
- Refund rate
- Blended ROAS
A front-end offer can intentionally run close to break-even if backend revenue makes the overall customer economics attractive.
But I only want to make that decision when the backend data is real.
For EdTech, I Separate Lead Generation From Enrolment Economics
Education campaigns can generate very large lead volumes.
That makes CPL easy to focus on.
But if the final objective is enrolment, I want to move further down the funnel.
I may look at:
- CPL
- Application or registration rate
- Qualified lead rate
- Counsellor contact rate
- Lead-to-enrolment rate
- Cost per enrolment
- Revenue per enrolment
This is especially important when comparing channels such as Google Search and YouTube.
One channel may create cheaper volume while another produces stronger intent.
For YouTube Ads, I Separate Media Engagement From Business Performance
YouTube gives me several useful media metrics such as view rate, CPV, CTR and watch behaviour.
I use those to understand how the video is performing.
But if the campaign objective is lead generation, I still want to get to CPL, lead quality and CAC.
A video can generate cheap views and still be a poor acquisition asset.
I cover this in more depth in my YouTube Ads metrics guide.
For Local or Service Businesses, Calls and Bookings May Matter More Than Forms
Some businesses do not need thousands of conversions.
They need a smaller number of high-intent enquiries.
For those accounts, I may track:
- Cost per qualified call
- Cost per booked appointment
- Show-up rate
- Close rate
- CAC
- Revenue generated
A campaign that generates fewer forms may still be much stronger if it generates more real conversations with potential customers.
The Funnel Stage Determines Which Metric I Use for Optimization
I also distinguish between the metric I use to optimize a campaign and the metric I use to judge the business outcome.
For example, I may optimize a Meta campaign using cost per qualified lead because that signal is available quickly.
But I may judge whether the campaign deserves more budget using CAC once enough sales data has accumulated.
Those two metrics can coexist.
I Prefer the Deepest Reliable Metric Available
This is probably the simplest way to explain my approach.
If all I reliably have is CTR, I use CTR.
If I have conversion data, I move to CPA or CPL.
If I have qualification data, I move to cost per qualified lead.
If I have customer data, I move to CAC.
If I have retention and margin data, I can start thinking about LTV and contribution.
The goal is to move measurement closer and closer to the actual economic outcome.
My Performance Marketing KPI Hierarchy Changes With the Business
For ecommerce, I may prioritize new-customer CAC, contribution and LTV.
For lead generation, I may prioritize qualified CPL, lead-to-sale rate and CAC.
For subscription businesses, I may prioritize CAC, payback and LTV.
For high-ticket services, I may prioritize qualified opportunities, close rate and CAC.
That is why I do not believe there is one universal dashboard that tells every business whether its performance marketing is working.
The metrics have to follow the economics of the business.
How Often I Review Performance Marketing Metrics: Daily, Weekly and Monthly
Another mistake I see is treating every performance marketing metric as if it needs the same level of attention every day.
It does not.
Some numbers help me catch problems quickly.
Some need several days of data before they become meaningful.
And some should only be judged over a longer customer window.
If I react to every metric every few hours, I can easily create more volatility than improvement.
What I Usually Watch Daily
My daily checks are mostly about detecting something unusual before it becomes expensive.
I may look at:
- Spend
- Conversions
- CPL or CPA
- Revenue
- ROAS
- Major changes in CAC where enough data exists
- CTR
- CPC
- CPM
- Conversion rate
- Tracking or delivery issues
I am not necessarily making changes because one metric moved for one day.
I am checking whether something has broken.
I Look for Abnormal Movement, Not Normal Noise
Paid media data moves naturally.
A campaign can have a strong Monday and a weaker Tuesday without anything actually being wrong.
So I do not want to overreact to every daily fluctuation.
I am more interested when several connected metrics move together.
If spend remains stable but conversions suddenly collapse, I investigate.
If CPM rises slightly for one day while CAC remains healthy, I may simply monitor it.
The scale of the account matters too.
Higher-Volume Accounts Give Me Faster Signals
If an account generates hundreds of conversions every day, I can often make decisions faster because there is more data.
If a campaign generates five conversions per week, daily ROAS or CAC can be extremely noisy.
I need a longer decision window.
This is why I do not use the same optimization cadence for every account.
What I Usually Review Weekly
The weekly view is where I start looking for patterns rather than isolated movement.
I may compare:
- Spend versus the previous week
- Conversions and customer volume
- CPL, CPA and CAC
- ROAS and MER
- Conversion rate
- Creative performance
- Search term performance
- Audience performance
- Lead quality
- New-customer performance
- Budget distribution
This is usually a much better window for deciding whether an optimization actually improved performance.
I Compare the Current Period With a Relevant Baseline
I do not automatically compare every week with the immediately previous week.
Sometimes that comparison is misleading.
If the previous week contained a major sale, festival, launch or promotion, the baseline is different.
I may compare against:
- The previous normal week
- The previous four-week average
- The same campaign before a major change
- The same period from an earlier month
The comparison should help explain performance, not simply produce another percentage change.
Weekly Reviews Are Where I Make More Structural Decisions
Daily monitoring helps me protect the account.
Weekly analysis is where I am more likely to make meaningful optimization decisions.
For example:
- Shift budget between campaigns
- Pause consistently weak creative
- Scale a winning campaign
- Launch new creative angles
- Exclude irrelevant search terms
- Change landing-page tests
- Adjust channel allocation
I still want those decisions connected to enough data rather than one good or bad day.
What I Usually Review Monthly
The monthly view is where I step further away from Ads Manager.
I want to understand whether paid acquisition is actually moving the business in the right direction.
This may include:
- Total ad spend
- Total revenue
- New-customer revenue
- Blended CAC
- MER
- Contribution margin
- Customer volume
- Lead-to-sale rate
- Channel mix
- AOV
- Repeat purchase behaviour
- Payback period
- LTV where enough data exists
This is where I ask whether we are just optimizing campaigns or actually improving the acquisition system.
I Review LTV and Retention Over Longer Windows
LTV is not something I expect to understand from yesterday’s data.
Customer lifetime value needs time.
I may look at customer cohorts based on when they were acquired.
For example:
How are customers acquired three months ago behaving now?
Did one channel produce better repeat purchase?
Did customers acquired through a heavy discount return less often?
Are newer cohorts becoming more or less valuable?
These are longer-term questions.
I Also Separate Reporting Cadence From Optimization Cadence
Just because I report a metric daily does not mean I optimize against it daily.
This distinction is important.
I may monitor CAC every day.
But if the business has a long sales cycle, I may need weeks before I know the true CAC of a lead cohort.
I may monitor YouTube CPL daily.
But I may judge lead quality over a longer period once the sales team has worked those leads.
Reporting frequency and decision frequency are not always the same thing.
I Avoid Making Too Many Changes at the Same Time
If I change the audience, budget, creative, landing page and bidding strategy together, I may improve performance.
But I may have no idea what caused the improvement.
That makes the next decision harder.
Whenever possible, I prefer changes that allow me to learn something.
This is one of the reasons I think disciplined measurement matters as much as the individual performance marketing KPIs themselves.
My Review Rhythm Is Simple
Daily: Is anything broken or behaving abnormally?
Weekly: What is improving, deteriorating or ready for optimization?
Monthly: Is the overall acquisition system producing better business economics?
Longer term: Are the customers we acquire actually becoming valuable?
That rhythm keeps me close enough to performance to react when necessary without letting short-term noise control every decision.
How I Set Performance Marketing Targets Without Using Random Benchmarks
I do not like setting performance marketing targets by copying numbers from another account, another industry or a benchmark report.
Benchmarks can give me context.
But they do not tell me what the business can actually afford.
I prefer working backward from the economics.
The question I am trying to answer is:
“What does this business need the numbers to be for paid acquisition to make sense?”
I Start With the Business Outcome
Before I set a target CPL, CAC or ROAS, I want to understand the end result.
For ecommerce, that may mean:
- Average order value
- Gross margin
- Contribution margin
- Repeat purchase behaviour
- New-customer revenue
For lead generation, I may need:
- Average customer value
- Lead-to-sale conversion rate
- Qualified lead rate
- Sales close rate
- Margin per customer
Once I understand those numbers, I can work backward toward the acquisition metric.
I Set an Allowable CAC Before I Decide What CPL Should Be
For lead generation, this is one of the most useful calculations I make.
Suppose the business can afford a maximum CAC of ₹10,000.
If 5% of leads become customers, the theoretical allowable CPL is:
₹10,000 × 5% = ₹500
If the campaign is generating leads at ₹300, there may be room.
If it is generating leads at ₹800, I either need better lead-to-sale conversion, higher customer value or lower acquisition cost.
This is much more useful than asking whether ₹500 CPL is “good” for the industry.
I Work Backward From Revenue Economics for Ecommerce
For ecommerce, I may start with how much contribution a new customer creates.
Suppose the average first order is ₹3,000.
After product cost, discounting, fulfilment and other variable costs, the business has ₹1,200 available before paid acquisition.
That tells me the first-order CAC cannot be judged independently from that ₹1,200 contribution.
If repeat purchase behaviour is strong, I may tolerate a higher CAC.
If most customers buy only once, I may need to stay much tighter.
I Set ROAS Targets From Economics, Not From Ego
I do not care whether another brand says it is running at 6X ROAS.
If my business can profitably scale at 2.5X, then 2.5X may be a perfectly healthy target.
The ROAS target should come from:
- Gross margin
- Contribution margin
- AOV
- Repeat purchase
- Customer acquisition goals
- Cash-flow requirements
A higher ROAS is not automatically better if protecting that ratio prevents the business from growing.
I Use a Target Range Instead of One Exact Number
Paid media is not perfectly stable.
So I usually prefer a range.
For example:
Target CAC: ₹1,200 to ₹1,400
Watch zone: ₹1,400 to ₹1,600
Problem zone: consistently above ₹1,600
The exact numbers depend on the business, but the structure helps me avoid reacting emotionally to one bad day.
I Separate Target, Break-Even and Maximum Tolerable CAC
These are not always the same number.
I may think about them as:
Target CAC: where I would ideally like acquisition to operate.
Break-even CAC: where the business roughly stops making contribution on the relevant customer window.
Maximum tolerable CAC: the upper limit I may temporarily accept while testing, scaling or learning.
That gives me much more flexibility than one rigid target.
I Do the Same With CPL
A target CPL should also have context.
Suppose the business historically closes 8% of qualified leads.
If lead quality starts weakening, the allowable CPL should change too.
This is why I do not freeze CPL targets permanently.
The downstream funnel determines what the business can afford upstream.
I Set Targets by Channel When the Intent Is Different
I do not always expect Meta, Google Search and YouTube to hit the same acquisition metric.
Google Search may produce a higher CPL but stronger intent.
Meta may generate cheaper volume.
YouTube may assist the funnel and convert over a longer window.
So I may set different working targets by channel while still judging all of them against the same business economics.
I Set Different Targets for Prospecting and Remarketing
I also separate cold acquisition from audiences who already know the brand.
I expect remarketing to behave differently.
If I use the same ROAS or CAC expectation for both, I can end up making poor budget decisions.
I want to know whether prospecting can acquire new customers at sustainable economics, not only whether remarketing looks efficient.
I Recalculate Targets When the Business Changes
Performance marketing targets are not permanent.
They can change when:
- Prices change
- Margins change
- AOV changes
- Lead-to-sale rate improves
- Retention improves
- Sales capacity changes
- Product mix changes
- Repeat purchase behaviour changes
If the underlying economics improve, I may be able to spend more aggressively.
If margins deteriorate, the same historical CAC may no longer be healthy.
I Use Benchmarks as a Question, Not an Answer
If I see an industry benchmark saying CTR should be 2%, I may use that as a reference point.
But I would rather know whether this account historically performs at 3.5% and has now fallen to 1.8%.
The account’s own performance history usually gives me a much stronger diagnostic baseline.
External benchmarks help me ask questions.
They do not replace the economics of the business.
My Rule for Setting Performance Marketing Targets Is Simple
I start as close to revenue and profit as the available data allows.
Then I work backward.
Customer economics → Allowable CAC → Allowable CPL or CPA → Required CVR → Supporting CPC, CTR and CPM
That way, every performance marketing KPI has a reason behind it.
I am not chasing numbers because they look good in a dashboard.
I am setting targets that support the economics the business actually needs.
The Performance Marketing Metric I Care About Most Is the One That Helps Me Make a Better Decision
After working across Meta Ads, Google Ads, YouTube Ads, lead generation and ecommerce, I have stopped looking for one universal performance marketing metric that explains everything.
There is no single number that does.
ROAS tells me about revenue efficiency.
CAC tells me what it costs to acquire a customer.
CPL helps me understand lead-generation efficiency.
CVR tells me how well the traffic is converting.
LTV tells me how much economic value may exist beyond the first transaction.
CTR, CPC and CPM help me diagnose what is happening before the conversion.
MER and blended CAC help me step outside platform attribution and look at the business as a whole.
I Prefer Metrics That Move Closer to Revenue
If I only have click data, I will use click data.
If I have conversion data, I move toward CPL or CPA.
If I have qualified lead data, I move further down the funnel.
If I have customer data, CAC becomes more important.
If I have reliable retention and margin data, I can start making decisions using LTV, payback and contribution.
The deeper the reliable data goes, the better my acquisition decisions usually become.
I Never Optimize a Metric Without Understanding What It Does to the Next Metric
This is probably the most important principle in this entire guide.
I do not want a higher CTR if it produces worse leads.
I do not want a lower CPL if CAC increases.
I do not want a higher CVR if customer quality collapses.
I do not want a higher ROAS if it comes only from cutting spend until the business stops growing.
I want the metrics improving in a way that supports the final business outcome.
My Performance Marketing Measurement Hierarchy
If I had to summarize how I think about performance marketing measurement, it would look like this:
Business outcome → Customer economics → Acquisition efficiency → Funnel efficiency → Platform diagnostics
In practical terms:
Revenue and contribution → CAC and LTV → CPL, CPA and ROAS → CVR → CPC, CTR and CPM
I may move backward through that chain when diagnosing a problem, but I try to judge success from the top.
A Good Dashboard Should Help Me Decide What to Do Next
I do not think a performance marketing dashboard needs 50 metrics.
It needs the right metrics.
When I open an account, I want to be able to answer:
- Are we acquiring enough customers?
- Are we paying an acceptable amount to acquire them?
- Are those customers valuable enough?
- Where is the funnel becoming less efficient?
- Which channel, campaign or creative deserves more budget?
- What should I fix before I scale further?
If the measurement system can answer those questions, it is doing its job.
Do Not Optimize the Dashboard. Optimize the Business.
That is ultimately how I approach performance marketing metrics.
The goal is not to make every number green.
The goal is to understand which numbers matter, how they connect and how they should influence the next acquisition decision.
If you are trying to understand why your paid media numbers look healthy but growth is still weak, my performance marketing audit framework explains how I diagnose the full acquisition system.
If you need help reviewing your own campaigns, funnel, tracking, CAC or scaling strategy, you can also see how I work as a performance marketing consultant in India.
For me, the best performance marketing metric is not the one that looks most impressive. It is the one that helps me make the next better decision.