A performance marketing account can show a healthy ROAS and still become worse at acquiring customers.
That sounds contradictory until you separate what ROAS measures from what customer acquisition cost measures.
ROAS tells you how much attributed revenue the advertising platform reports relative to ad spend. CAC tells you what it costs to acquire a customer, depending on the definition your business uses.
Those numbers are related, but they are not interchangeable.
AOV can increase. Returning customers can contribute more revenue. Attribution can shift. Discounts can lift conversion. Retargeting can capture existing demand.
Any of those things can protect reported ROAS while the business becomes less efficient at acquiring new customers.
After almost 10 years working across paid acquisition, this is one of the mistakes I see in performance analysis repeatedly: teams optimize the number that looks strongest instead of tracing how new customers are actually being acquired.
Here are 10 performance marketing mistakes that can increase CAC even when ROAS still looks fine.
First, understand how ROAS and CAC can move in different directions
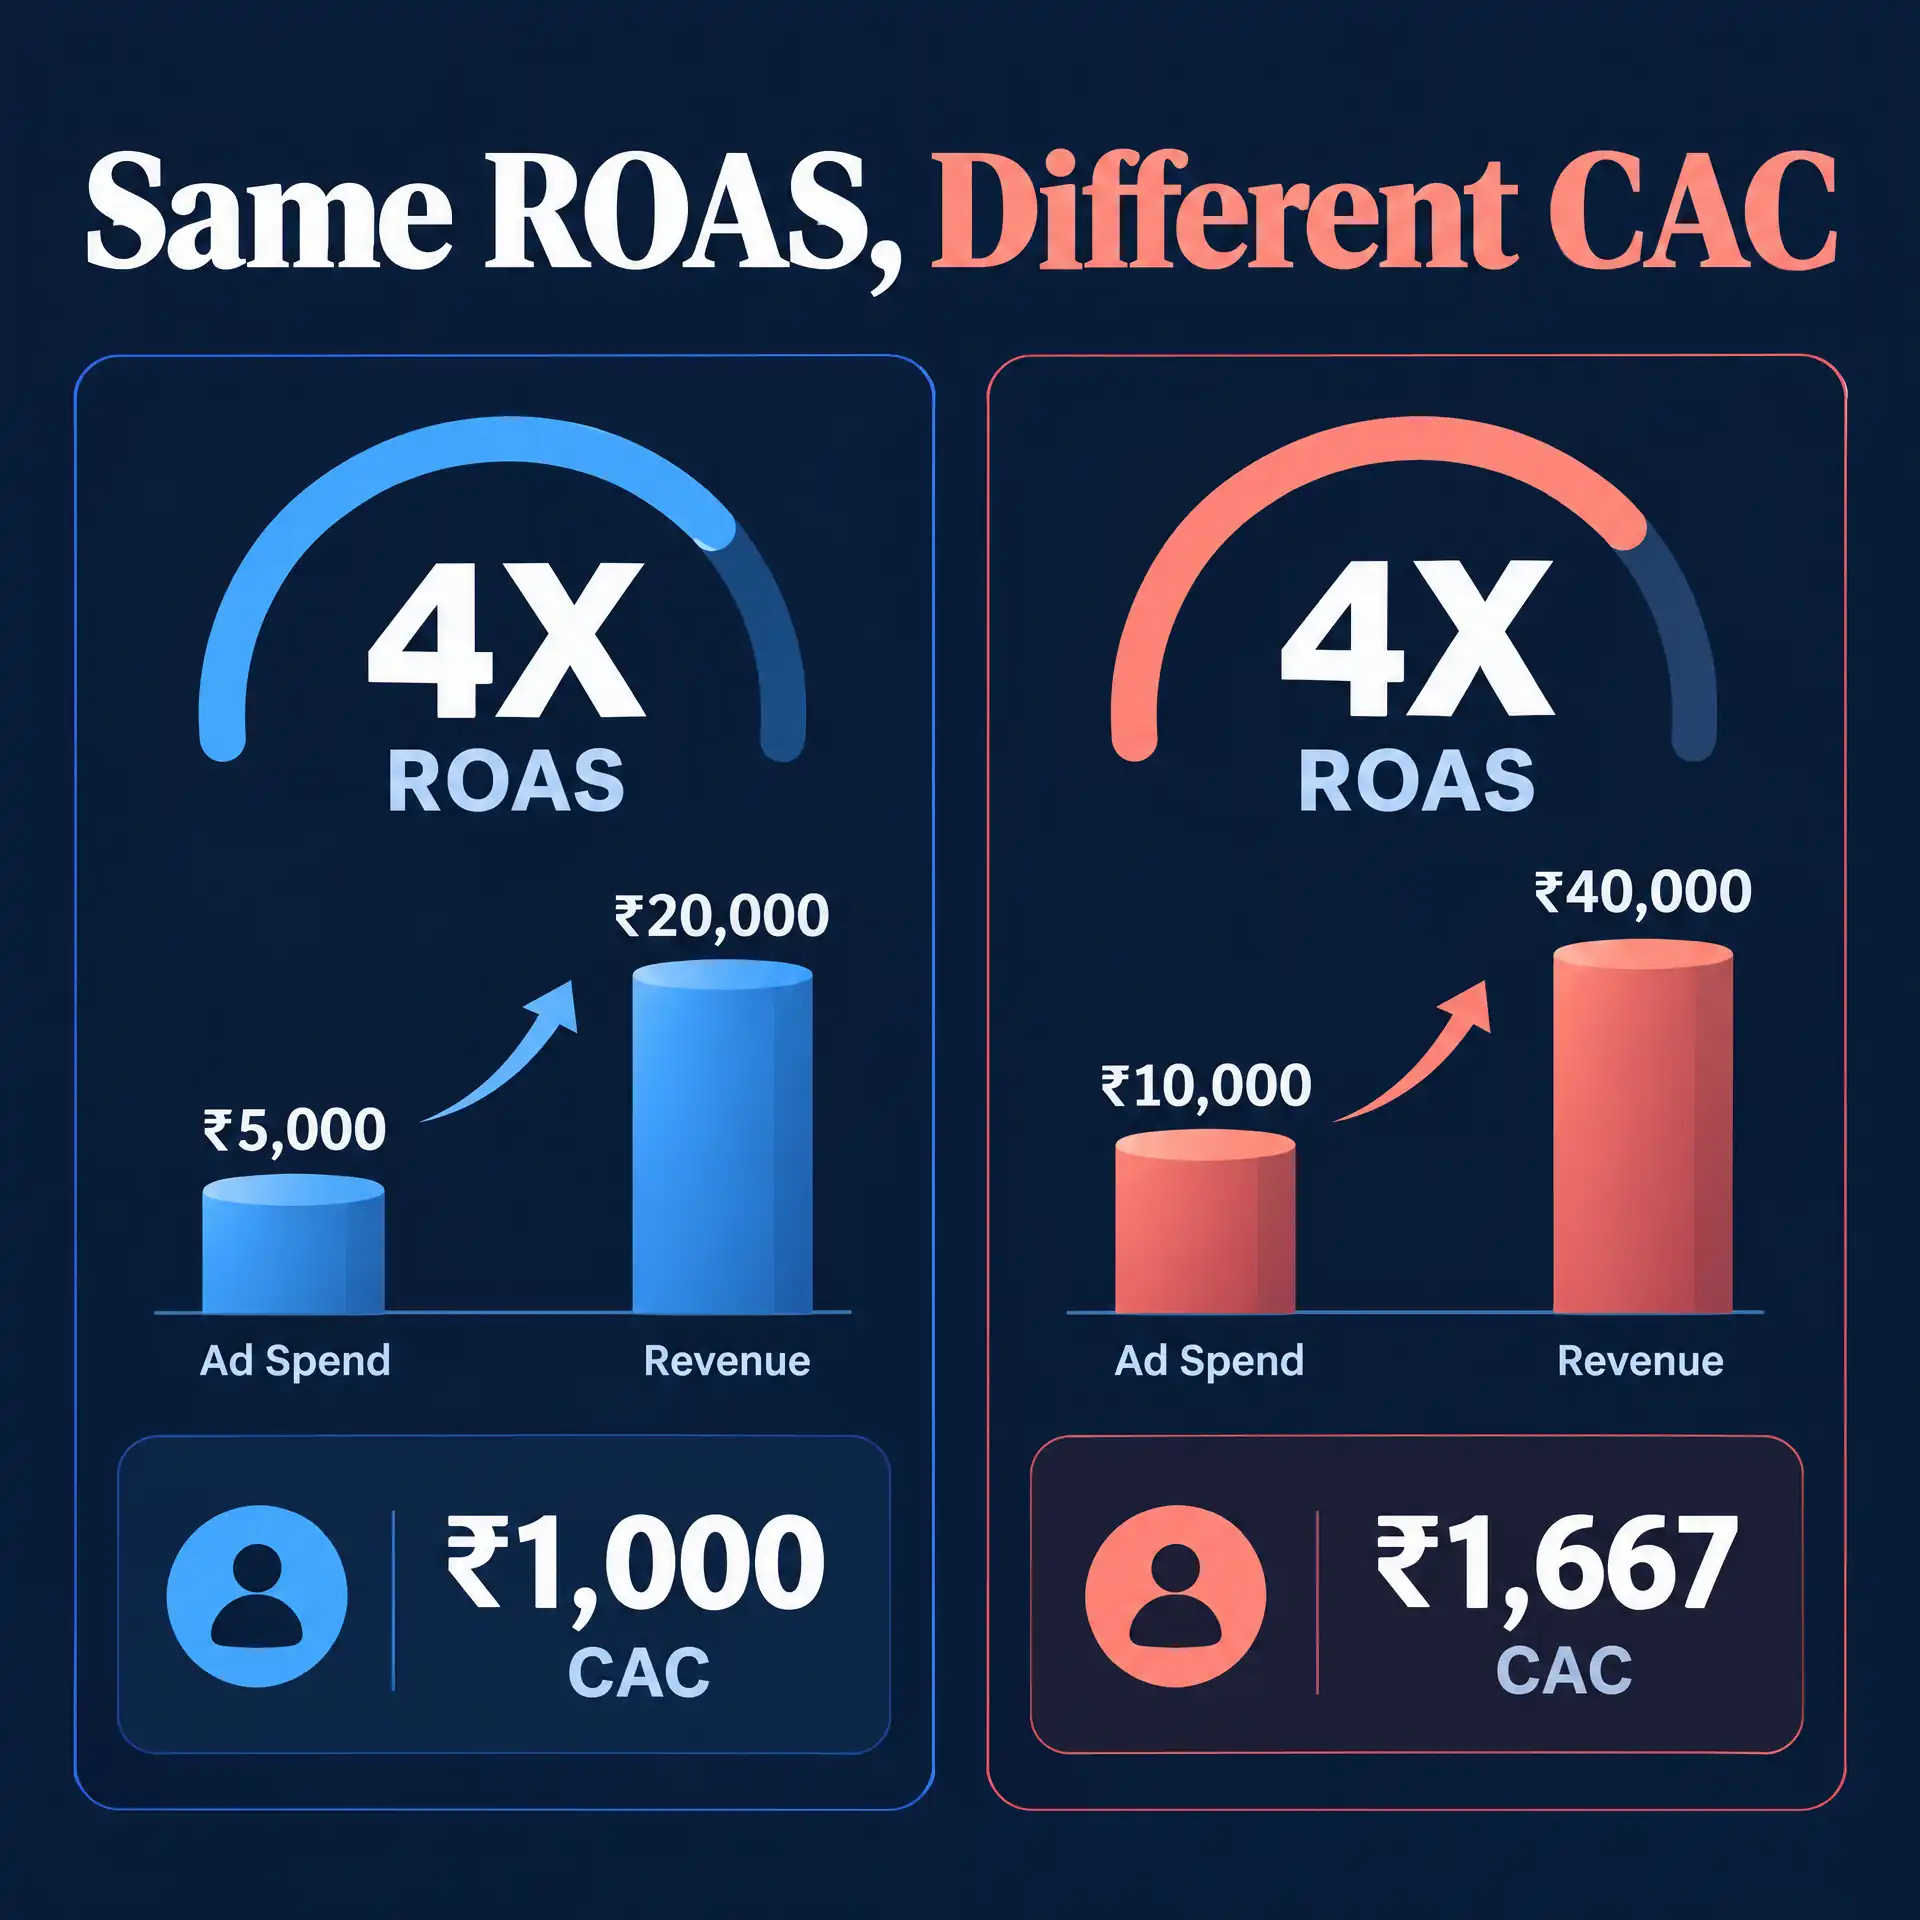
Before the mistakes, consider a simple hypothetical example.
Month 1:
- Ad spend: ₹1,00,000
- Attributed revenue: ₹4,00,000
- ROAS: 4X
- New customers: 100
- Media-only new customer CAC: ₹1,000
Now suppose the next month looks like this.
Month 2:
- Ad spend: ₹1,00,000
- Attributed revenue: ₹4,00,000
- ROAS: 4X
- New customers: 60
- Media-only new customer CAC: approximately ₹1,667
ROAS has not changed.
But the cost of acquiring a new customer has increased by roughly 67%.
How can that happen?
Perhaps returning customers generated more of the attributed revenue. Maybe average order value increased. Maybe a higher-value product mix protected revenue while fewer first-time customers were acquired.
The dashboard can therefore look stable while the acquisition engine is weakening.
I call this the ROAS-to-CAC gap.
The wider that gap becomes, the more important it is to understand what is actually producing the revenue.
1. Treating platform ROAS as the final measure of business performance
ROAS is useful.
The mistake is asking it to answer questions it was never designed to answer.
ROAS = Attributed Revenue ÷ Advertising Spend
It tells you how much attributed revenue is being reported for each unit of ad spend.
It does not automatically tell you:
- how many new customers were acquired,
- whether those customers were profitable,
- how much margin remained after fulfilment,
- whether the revenue came from new or returning buyers,
- whether another channel also claimed credit,
- whether the orders were later cancelled or refunded,
- or whether the business can sustain the CAC at higher spend.
Why this increases CAC quietly
Imagine a brand increasing spend while platform ROAS remains around 4X.
If the number of new customers does not increase proportionately, new-customer CAC rises even though the headline return remains stable.
This can happen when more attributed revenue comes from repeat customers or people already close to buying.
What I would inspect
I would compare platform ROAS with new-customer acquisition, customer mix and the business’s own revenue records where the data exists.
I would also ask whether the reported revenue represents the outcome we actually want to scale.
The correct question is not:
“Is ROAS good?”
It is:
“What kind of growth is producing this ROAS?”
My ROAS vs CAC guide goes deeper into why the two metrics should be interpreted together.
2. Mixing new-customer revenue and returning-customer revenue when evaluating acquisition
A returning customer placing another order is valuable.
But it is not the same economic event as acquiring a new customer.
This distinction becomes especially important when a business evaluates paid acquisition using blended platform revenue.
Why returning customers can make acquisition look stronger
Suppose two brands each spend ₹5 lakh and report ₹20 lakh in attributed revenue.
Both show 4X ROAS.
Brand A receives most of that revenue from first-time customers.
Brand B receives a large share from people who purchased before.
The same ROAS now represents two very different acquisition outcomes.
Brand B may still have an excellent business.
But if the purpose of the advertising budget is customer acquisition, we should understand how many new customers the spend is actually adding.
This matters more as a brand matures
As the customer database grows, more previous buyers can re-enter the website through paid campaigns, branded search, retargeting or other touchpoints.
That can strengthen reported channel performance without creating the same amount of incremental demand.
What I would monitor
Where the data is available, I would look at:
- new versus returning customer revenue,
- new-customer CAC,
- new-customer share,
- repeat purchase behaviour,
- prospecting versus retargeting spend,
- and blended business performance.
The objective is not to devalue retention.
Retention can make a business dramatically stronger.
The objective is to avoid using returning-customer revenue as evidence that new-customer acquisition is equally healthy.
3. Scaling because average ROAS looks good without measuring the economics of the next rupee
This is one of the easiest ways to turn a profitable campaign into expensive growth.
Average performance tells you what happened across all existing spend.
Scaling requires you to think about what happens to the additional spend.
Consider a hypothetical campaign
At ₹5 lakh in spend, it generates ₹25 lakh in attributed revenue.
ROAS is 5X.
You increase spend to ₹10 lakh.
Total attributed revenue becomes ₹40 lakh.
ROAS falls to 4X.
Many teams immediately say efficiency deteriorated.
That may be true, but the more useful question is what the additional ₹5 lakh produced.
It generated another ₹15 lakh in attributed revenue.
The decision should now depend on whether that incremental acquisition creates acceptable customers, contribution and future value.
The reverse can also happen
Average ROAS may remain strong because efficient historical spend or retargeting protects the overall number.
Meanwhile, the newest budget may be acquiring customers at a much higher cost.
If you look only at the average, marginal deterioration can remain hidden.
My scaling question
I do not ask only:
“Can we spend more?”
I ask:
“Can the next rupee acquire additional business at economics we are willing to accept?”
That is a different question.
And it is much closer to what scaling actually means.
4. Ignoring contribution margin, discounts, refunds and fulfilment while celebrating revenue
Revenue is not profit.
That sounds obvious, yet paid advertising decisions are often made from revenue metrics with very little discussion of what remains after the order.
Two products can have identical ROAS and very different economics
Suppose Product A and Product B both produce 4X ROAS.
Product A has strong gross margin, low shipping cost and very few returns.
Product B requires a large discount, expensive fulfilment and generates significantly more returns.
The platform treats both as revenue.
The business does not receive the same economic value.
COD makes this distinction especially important
For cash-on-delivery ecommerce, placed orders and fulfilled orders can tell different stories.
A campaign may appear strong when judged on orders recorded at checkout but become less attractive after cancellations, refusals or failed deliveries.
In my documented D2C hair-oil work, Meta Ads generated more than ₹1.43Cr in COD revenue.
I use that result as evidence of hands-on ecommerce acquisition experience. I do not automatically convert the headline revenue number into a claim about fulfilment or contribution without the corresponding data.
What I would connect to acquisition
Depending on the business, that may include:
- AOV,
- gross margin,
- contribution margin,
- discount rate,
- returns,
- cancellations,
- shipping and fulfilment,
- payment costs,
- repeat purchase.
You do not need every metric inside the ad platform.
You need enough business context to know whether the acquisition being scaled is economically valuable.
5. Calculating CAC differently every time and then comparing the numbers
CAC is one of the most useful metrics in performance marketing.
It is also one of the easiest to define inconsistently.
Media-only CAC
A useful operational view can be:
Media-only CAC = Advertising Spend ÷ New Customers Acquired
This can help compare paid acquisition efficiency when the business uses the same definition consistently.
Fully loaded CAC
A broader business view may include additional acquisition-related expenses such as:
- advertising spend,
- agency or specialist fees,
- creative production,
- marketing technology,
- relevant sales costs,
- other acquisition expenses.
The appropriate definition depends on the decision being made.
Shopify’s current ecommerce acquisition guidance similarly defines CAC using total sales and marketing spend divided by new customers, and warns that using only ad spend can understate the full acquisition cost.
The mistake is not choosing one definition over another
The mistake is comparing two CAC numbers that were calculated differently.
If January CAC includes only Meta and Google spend while February CAC includes agency fees and creative production, the apparent trend is partly a measurement change.
Likewise, if one dashboard divides by all purchasers and another divides only by first-time customers, those are different metrics.
Define the metric before optimizing it
Whenever I discuss CAC, I want the denominator and numerator to be explicit.
That reduces false precision and makes period-to-period comparisons much more useful.
6. Sending more paid traffic into a funnel that converts poorly
Sometimes CAC is rising because the media got worse.
Sometimes the advertising is sending perfectly reasonable traffic into a funnel that has become less effective.
That distinction matters.
Look at the complete path
A simple ecommerce path might look like:
Impression → Click → Product Page → Add to Cart → Checkout → Purchase
A lead-generation path might look like:
Impression → Click → Landing Page → Lead → Qualified Lead → Customer
Every stage affects the economics of the traffic before it.
A simple conversion-rate example
Suppose you spend ₹10 lakh to generate 20,000 relevant website visitors.
If the site converts at 2%, you generate 400 conversions.
Media cost per conversion is ₹2,500.
If conversion rate falls to 1.5% while traffic cost stays exactly the same, you now generate 300 conversions.
Cost per conversion increases to approximately ₹3,333.
Nothing about the media buying had to change for acquisition cost to increase by roughly one-third.
Scaling the traffic can amplify the leak
If the team responds by increasing advertising spend, the business is paying to push more users through the same weak conversion path.
That is why I consider conversion rate optimization part of performance marketing.
The question is not just how efficiently we buy the click.
It is how efficiently the acquisition system turns that click into a business outcome.
My performance marketing funnel guide explains this relationship across ads, landing pages, conversion, qualification and remarketing.
7. Optimizing for the easiest conversion instead of the most valuable outcome
Advertising platforms need conversion signals.
But the easiest event to generate is not always the event the business ultimately values most.
Google Ads itself defines a conversion action as a customer activity the advertiser considers valuable, such as a purchase, sign-up or phone call.
The important word is valuable.
Lead generation makes this problem obvious
Suppose Campaign A generates 1,000 leads at ₹200 CPL.
Campaign B generates 600 leads at ₹300 CPL.
Campaign A looks much stronger when judged only on CPL.
Now imagine:
- Campaign A generates 100 qualified leads.
- Campaign B generates 240 qualified leads.
Campaign A spends ₹2 lakh, so qualified lead cost is ₹2,000.
Campaign B spends ₹1.8 lakh, so qualified lead cost is ₹750.
The campaign with the worse CPL is now dramatically more efficient at producing qualified demand.
The same principle applies to ecommerce
A campaign optimized around recorded purchases may generate a different customer mix from one evaluated on new-customer economics.
The platform does not automatically know every nuance of what your business values.
The business has to define the outcome and build measurement around it.
What I would ask
“If this campaign became twice as good at generating the conversion event we selected, would the business definitely become healthier?”
If the answer is uncertain, the optimization signal deserves a deeper review.
8. Comparing channel ROAS without accounting for attribution and demand capture
Performance marketers often compare Meta, Google Search, Shopping, Performance Max, YouTube and other channels using platform-reported ROAS.
The problem is that each platform can observe and attribute customer journeys differently.
A customer may interact with multiple channels
Someone can see a Meta ad today.
Tomorrow they watch a YouTube video.
Two days later they search for the brand on Google and purchase.
Which channel created the customer?
The answer depends partly on the question you are asking and the attribution methodology being used.
Google Analytics explicitly treats attribution as assigning credit across the ads, clicks and other touchpoints that contribute to a meaningful action.
Branded search creates a common interpretation problem
Brand Search can show excellent ROAS because the person searching already knows the business.
That does not make branded Search worthless.
It means the campaign may be capturing demand that another activity helped create.
The mistake is turning attribution into a winner-takes-all competition
If Google claims the final conversion while Meta influenced discovery earlier, blindly shifting all budget toward the channel with the strongest last-touch economics can weaken demand creation.
The reverse is also possible.
A platform can claim influence that looks stronger than the business-level incrementality ultimately supports.
What I would compare
Depending on measurement maturity, I may look at:
- platform attribution,
- GA4 attribution,
- first-user and session acquisition,
- branded search behaviour,
- new-customer acquisition,
- blended revenue,
- MER,
- incremental tests where practical.
No single view gives perfect truth.
The goal is to make a better budget decision using multiple pieces of evidence.
9. Changing too many things at once and calling the result optimization
Performance marketing requires iteration.
But constant activity is not the same as learning.
If campaigns, creatives, budgets, bids, landing pages and offers all change in the same week, performance may improve without teaching the team what actually caused the improvement.
This creates an expensive future problem
Imagine CAC falls 20% after five major changes.
Everyone celebrates.
Three weeks later CAC rises again.
Which of the five changes should you reverse?
You do not know because the account produced an outcome without producing useful learning.
I prefer a decision loop
Observation → Hypothesis → Change → Evidence → Decision
Not every test needs laboratory-level isolation.
Real advertising environments are messy.
But each meaningful change should still have a reason.
Example
If conversion rate falls while CPM, CPC and traffic quality remain relatively stable, I would become more interested in the landing page or offer.
I would not automatically change the audience, bidding strategy, creative and page simultaneously.
If the page change improves conversion, we have learned something useful.
If it does not, the next hypothesis becomes clearer.
This is also why my performance marketing audit framework focuses on diagnosis before optimization.
10. Ignoring customer quality, retention and payback after acquisition
CAC tells you what it cost to acquire the customer.
It does not tell you what that customer becomes worth over time.
That makes customer quality important when evaluating how much CAC a business can support.
Two acquisition sources can produce customers with different economics
Suppose Channel A acquires customers at ₹800.
Channel B acquires customers at ₹1,200.
At first glance, Channel A appears clearly better.
Now imagine Channel B customers have larger initial orders, repeat more often or generate stronger contribution over time.
The higher CAC may still produce the better business outcome.
The opposite can also happen.
A channel may report excellent first-order ROAS while attracting customers who rarely repurchase.
Do not invent LTV to justify expensive acquisition
This is an important caveat.
Lifetime value should come from real customer behaviour or a defensible cohort model.
It should not be used as an optimistic future number to make an uneconomic campaign look acceptable today.
Useful questions include
- How quickly do we recover CAC?
- How many customers purchase again?
- Does repeat behaviour differ by acquisition source?
- Are high-CAC cohorts actually higher-value customers?
- How much contribution is generated before the business needs to reinvest?
The longer the payback period, the more working capital the business may need to support growth.
This is why customer acquisition cannot be judged exclusively from the first transaction.
The ROAS-to-CAC Diagnostic Bridge
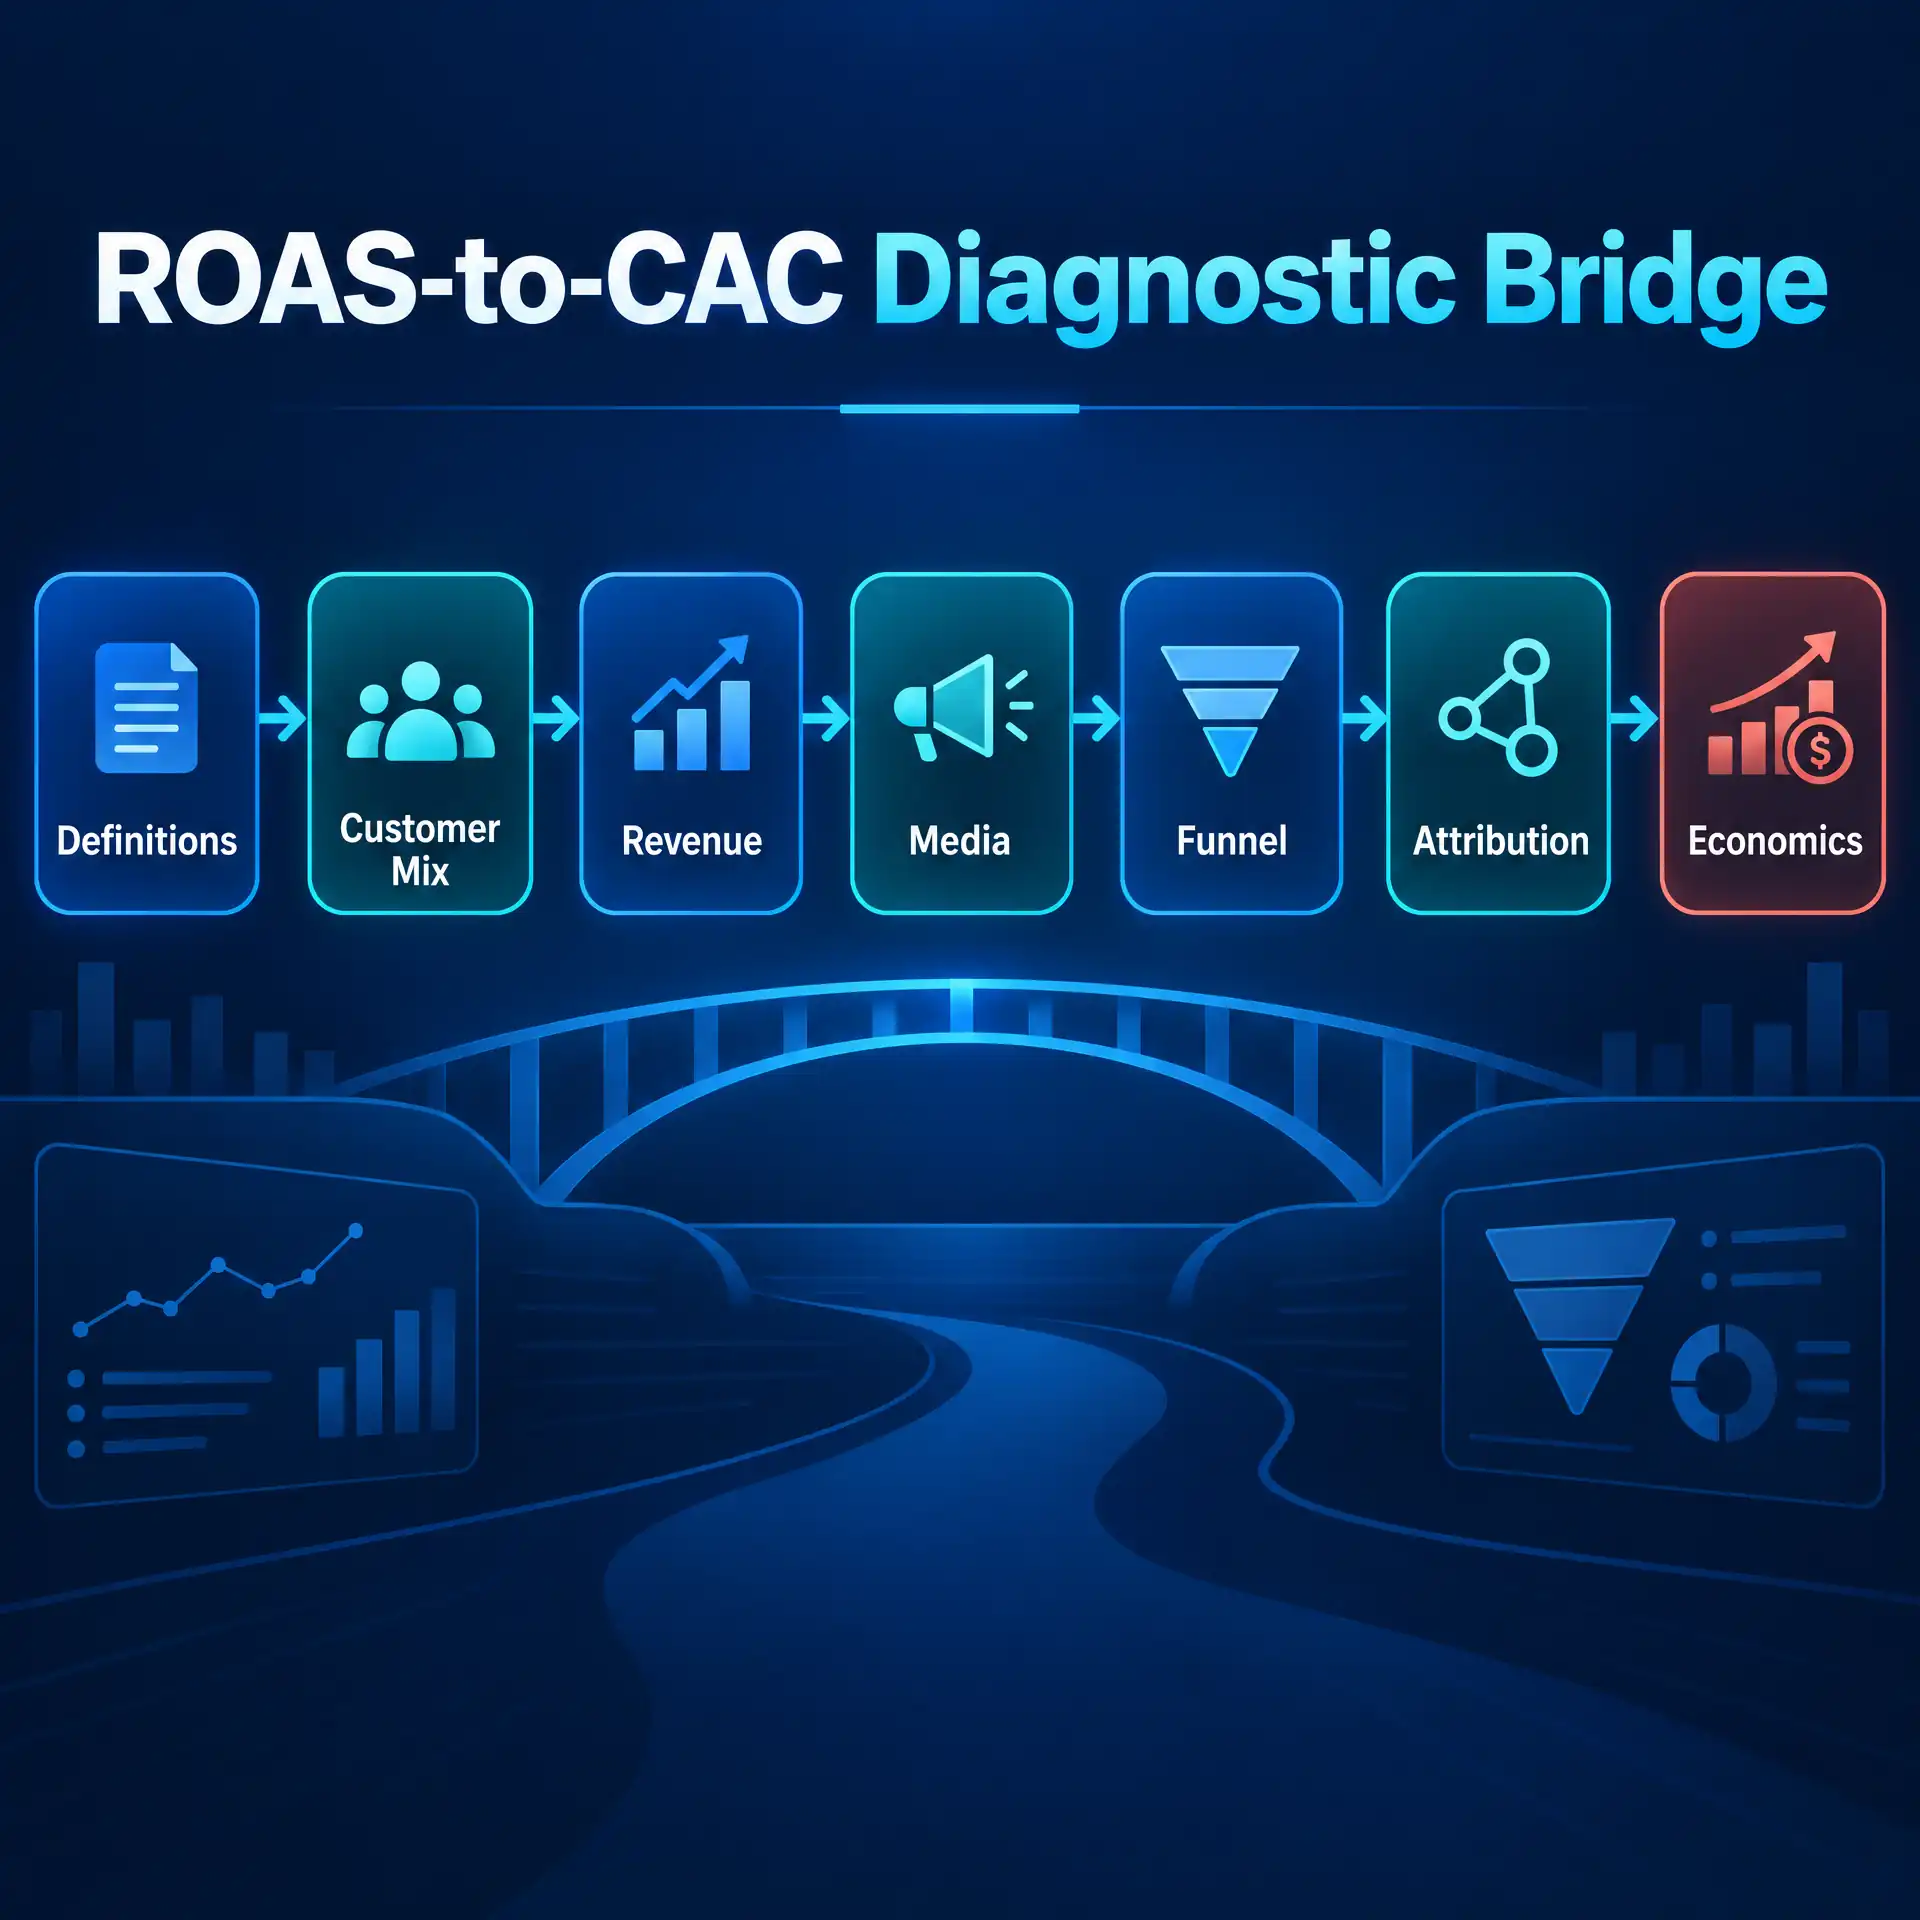
When ROAS looks healthy but CAC is increasing, I would not immediately assume the advertising platform is failing.
I would work through the following diagnostic sequence.
Step 1: Verify the definitions
What exactly does the business mean by CAC?
Is it media-only CAC, channel CAC, blended CAC or fully loaded acquisition cost?
Are we dividing by all customers or only new customers?
Step 2: Check customer mix
Did the share of returning customers increase?
Did prospecting contribution decline while retargeting became more dominant?
Step 3: Check revenue composition
Did AOV change?
Did product mix change?
Did discounts, upsells or bundles increase attributed revenue?
Step 4: Check media efficiency
Review CPM, CPC, CTR and other relevant delivery metrics.
Determine whether acquiring the traffic itself became more expensive.
Step 5: Check funnel conversion
Did landing-page, form, checkout or sales conversion change?
A healthy traffic layer can still produce worsening CAC when conversion deteriorates downstream.
Step 6: Check attribution
Did attribution settings, tracking or customer journeys change?
Are multiple channels claiming parts of the same demand?
Step 7: Check business economics
After margin, cancellations, fulfilment and customer quality, is the additional acquisition still creating acceptable value?
This bridge helps explain why the same reported ROAS can coexist with very different acquisition economics.
What should you monitor alongside ROAS?
I would not solve the problem by replacing ROAS with one new universal KPI.
The right set depends on the business.
For ecommerce, useful metrics may include
- new-customer CAC,
- new-customer ROAS where measurable,
- AOV,
- conversion rate,
- new-customer share,
- repeat purchase rate,
- MER,
- contribution margin,
- refund or cancellation rate,
- CAC payback.
For lead generation, useful metrics may include
- CPL,
- qualified lead rate,
- cost per qualified lead,
- appointment or opportunity rate,
- lead-to-customer conversion,
- media-only CAC,
- revenue per acquired customer.
You do not need every metric in every report.
You need the metrics that explain the economic path from advertising spend to customers.
My performance marketing metrics guide covers the role of ROAS, CAC, CPL, CVR and LTV in more detail.
A quick CAC diagnostic: where did the economics actually change?
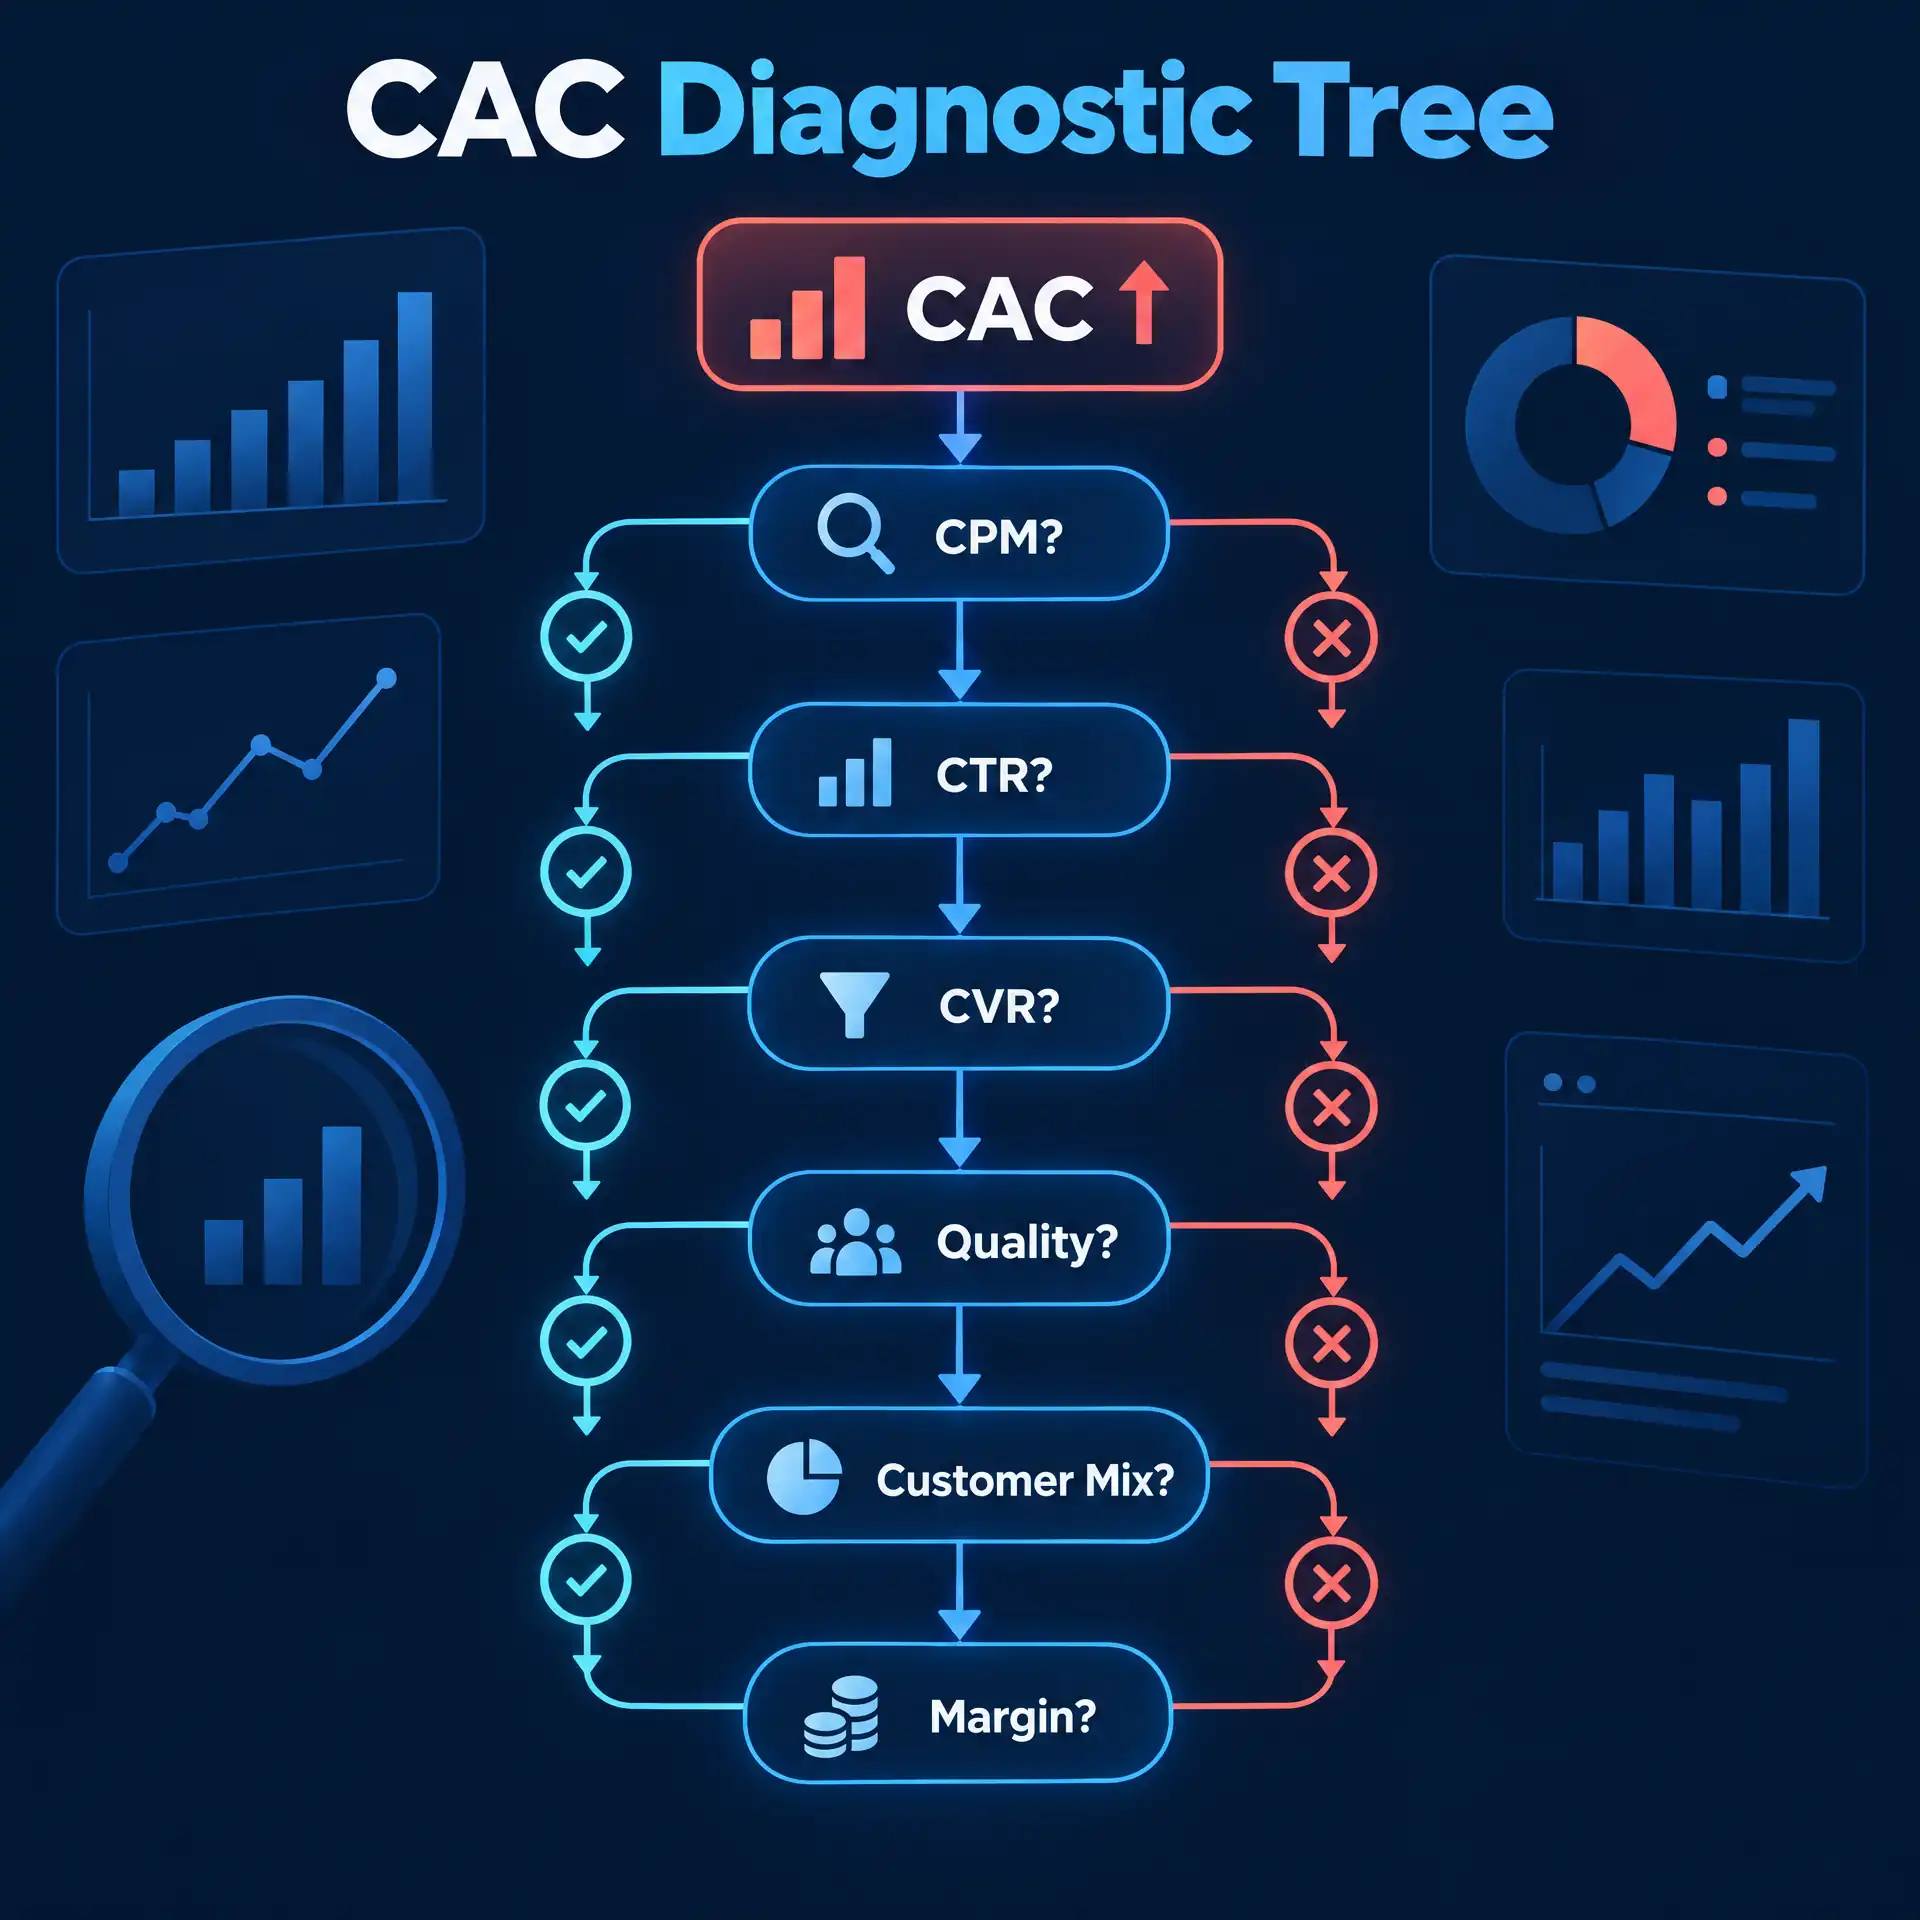
If CAC rises, I usually want to locate the first meaningful deterioration in the acquisition chain.
CPM up?
You may be paying more to access the same amount of inventory.
CTR down?
Creative or message response may be weakening.
CPC up?
The combination of auction cost and response efficiency may have deteriorated.
Traffic stable but CVR down?
Inspect the landing page, offer, checkout, form or sales journey.
Conversions stable but qualified outcomes down?
Inspect customer or lead quality.
Customers stable but CAC up?
Acquisition spend may be increasing faster than customer volume.
Platform performance stable but business profit down?
Inspect margin, product mix, discounts, fulfilment, refunds and customer mix.
This diagnostic sequence is much more useful than simply asking whether ROAS is above or below an arbitrary benchmark.
Why a higher CAC is not always bad
CAC increasing does not automatically mean performance marketing has failed.
Sometimes the business intentionally accepts a higher acquisition cost to reach more customers.
Sometimes a new market has higher media costs but attractive customer value.
Sometimes a campaign acquires customers who repeat more often.
Sometimes increasing spend pushes the business beyond the easiest demand and average efficiency naturally declines.
The question is whether the incremental economics still work
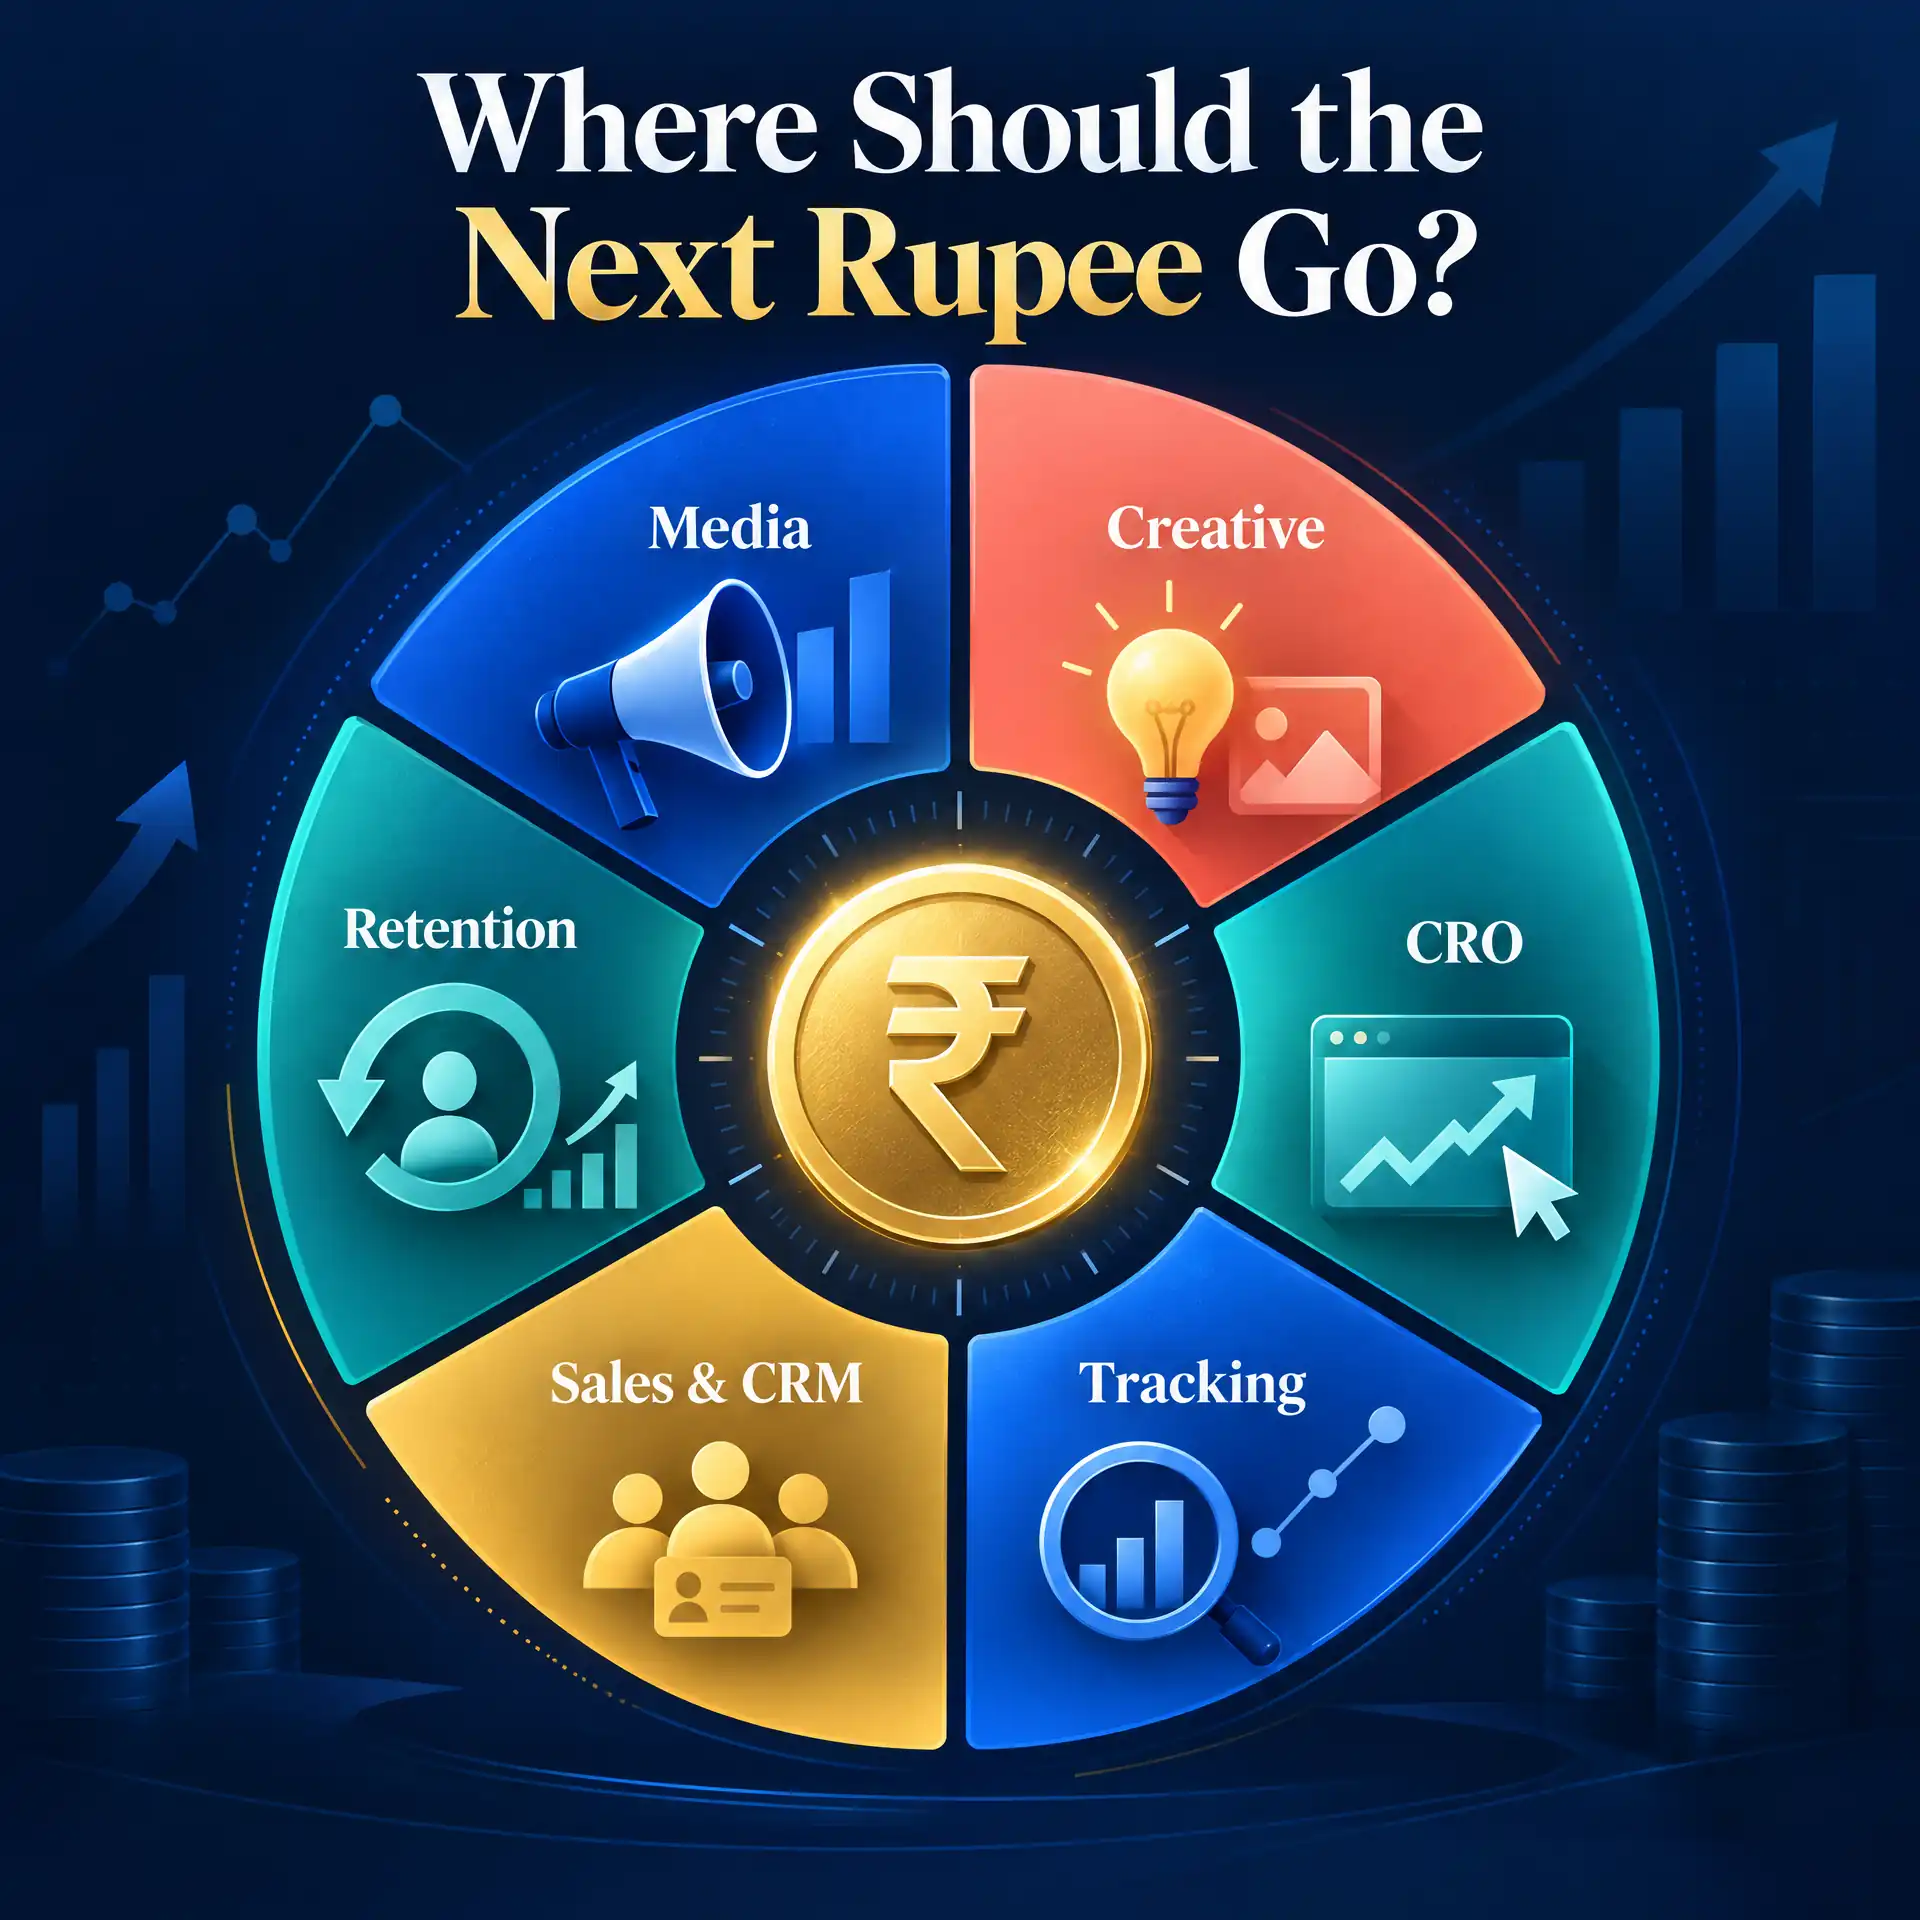
Suppose CAC increases from ₹1,000 to ₹1,300 while monthly new customers increase from 500 to 1,000.
The higher CAC may be perfectly acceptable if the additional customers still generate sufficient contribution and fit the business’s cash-flow requirements.
Conversely, reducing CAC from ₹1,000 to ₹700 by cutting prospecting spend dramatically is not necessarily a victory if the business stops adding enough new customers.
Efficiency and scale have to be evaluated together.
Why a strong ROAS can sometimes be a warning sign
This sounds strange, but an extremely high ROAS can occasionally tell me to ask more questions rather than immediately increase the budget.
Perhaps the campaign is underspending
A campaign can look exceptionally efficient because it is capturing only the easiest slice of available demand.
Increasing spend may lower average efficiency but create far more total profit.
Perhaps the activity is dominated by retargeting
Very warm users naturally have a different probability of buying than cold prospects.
High retargeting ROAS therefore does not automatically indicate strong new-customer acquisition.
Perhaps branded demand is doing the heavy lifting
Searchers already looking for the business can make a channel look extremely efficient.
The strategic question is where that demand originated.
Perhaps the business is optimizing for efficiency instead of growth
If the campaign could profitably acquire many more customers at a somewhat lower ROAS, protecting the highest possible percentage may leave profitable growth unused.
The objective is not the prettiest dashboard.
It is the strongest sustainable business outcome.
The performance marketing mistake behind many of the other mistakes
The common pattern across all ten issues is optimizing a proxy without understanding what it represents.
ROAS is a proxy for attributed revenue efficiency.
CPL is a proxy for the cost of creating a lead event.
CTR is a proxy for response to an ad.
Conversion rate is a proxy for how efficiently a particular step converts traffic.
Each is useful.
None independently tells you whether the business is acquiring profitable incremental customers.
A performance marketer’s job is to connect those signals.
That means understanding:
Media → Creative → Funnel → Conversion → Customer → Economics
When that chain is visible, performance metrics become diagnostic tools instead of scoreboard numbers.
How I think about rising CAC
Across almost 10 years of hands-on performance marketing, I have worked across Meta Ads, Google Ads, YouTube Ads, ecommerce, lead generation, tracking, analytics, CRO and acquisition funnels.
The experience has made me cautious about diagnosing a performance problem from one metric.
If CAC rises, I do not immediately assume the audience is exhausted.
I want to know what changed first.
Was traffic more expensive?
Did creative response weaken?
Did conversion rate fall?
Did customer quality change?
Did the product mix change?
Did attribution change?
Did the business increase spend beyond the previous efficient range?
Only then does the next action become clearer.
That same diagnostic philosophy underpins how I approach performance marketing and account diagnosis.
Final thought: optimize the acquisition system, not the prettiest metric
A healthy ROAS is useful information.
It is not permission to stop asking questions.
If new-customer CAC is rising, understand why.
Check customer mix.
Check incremental spend.
Check conversion rate.
Check attribution.
Check margin and fulfilment.
Check whether the conversion event being optimized actually represents a commercially valuable customer.
And check whether the additional customers you are buying still create enough value to justify the additional investment.
The objective of performance marketing is not to maximize one platform number.
It is to build a system where the business understands how advertising spend turns into profitable customer growth.
If your dashboards look healthy but acquisition economics are becoming harder to explain, a structured performance marketing audit is often a better next step than making another round of campaign changes.